Compare a future price with the purchasing power of a fixed dollar amount.
The interactive form requires JavaScript. The worked example, formulas and source links below remain available.
Read the inflation calculator result
An inflation calculator answers two related questions. How much might a basket costing a chosen amount today cost after several years of assumed price increases? And how much purchasing power would an unchanged dollar amount have at that future date, expressed in today’s dollars? This tool shows both results so a future account balance isn’t confused with what that balance could buy.
You choose a constant annual inflation assumption and a whole number of years. The calculator doesn’t retrieve historical Consumer Price Index data or forecast future inflation. Its default 3% rate is an illustration, not a statement about current conditions or an official projection.
Inflation: define the amount and the planning question
The amount can represent a current annual expense, a savings balance, or another dollar figure you want to compare across time. Give it a clear meaning before using the outputs. If $10,000 is the current price of a group of expenses, future cost estimates the later dollars needed for the same assumed purchasing power. If $10,000 is cash that remains unchanged, future purchasing power estimates its value in today’s dollars.
The annual inflation input is an effective annual percentage change applied repeatedly. A 3% assumption means each year’s price level is 1.03 times the previous year’s. The years input determines how many times that factor compounds. At zero years, both dollar outputs equal the original amount.
Use more than one assumption for a long-term decision. Small differences can become meaningful over many years. Choose the range for the purpose of the plan and identify its source or rationale; don’t give an arbitrary rate the authority of a forecast merely because the inflation calculator produces precise cents.
How the inflation calculator works
Let A be the amount, i the annual inflation rate expressed as a decimal, and t the number of years. The price-level factor is (1 + i)t. Future equivalent cost is A multiplied by that factor. Future purchasing power of unchanged cash is A divided by the same factor.
Cost change is future equivalent cost minus A. Cumulative inflation is [(1 + i)t − 1] × 100%. This cumulative percentage is different from simply multiplying the annual rate by the years, because later increases apply to an already higher price level.
These are mathematical translations under the entered assumptions. They do not include investment returns, savings contributions, taxes, fees, or changes in the mix of goods you buy. If the amount grows through saving or investing, project that future balance separately before converting it into today’s-dollar terms.
Inflation calculator example: $10,000, 3% inflation, and ten years
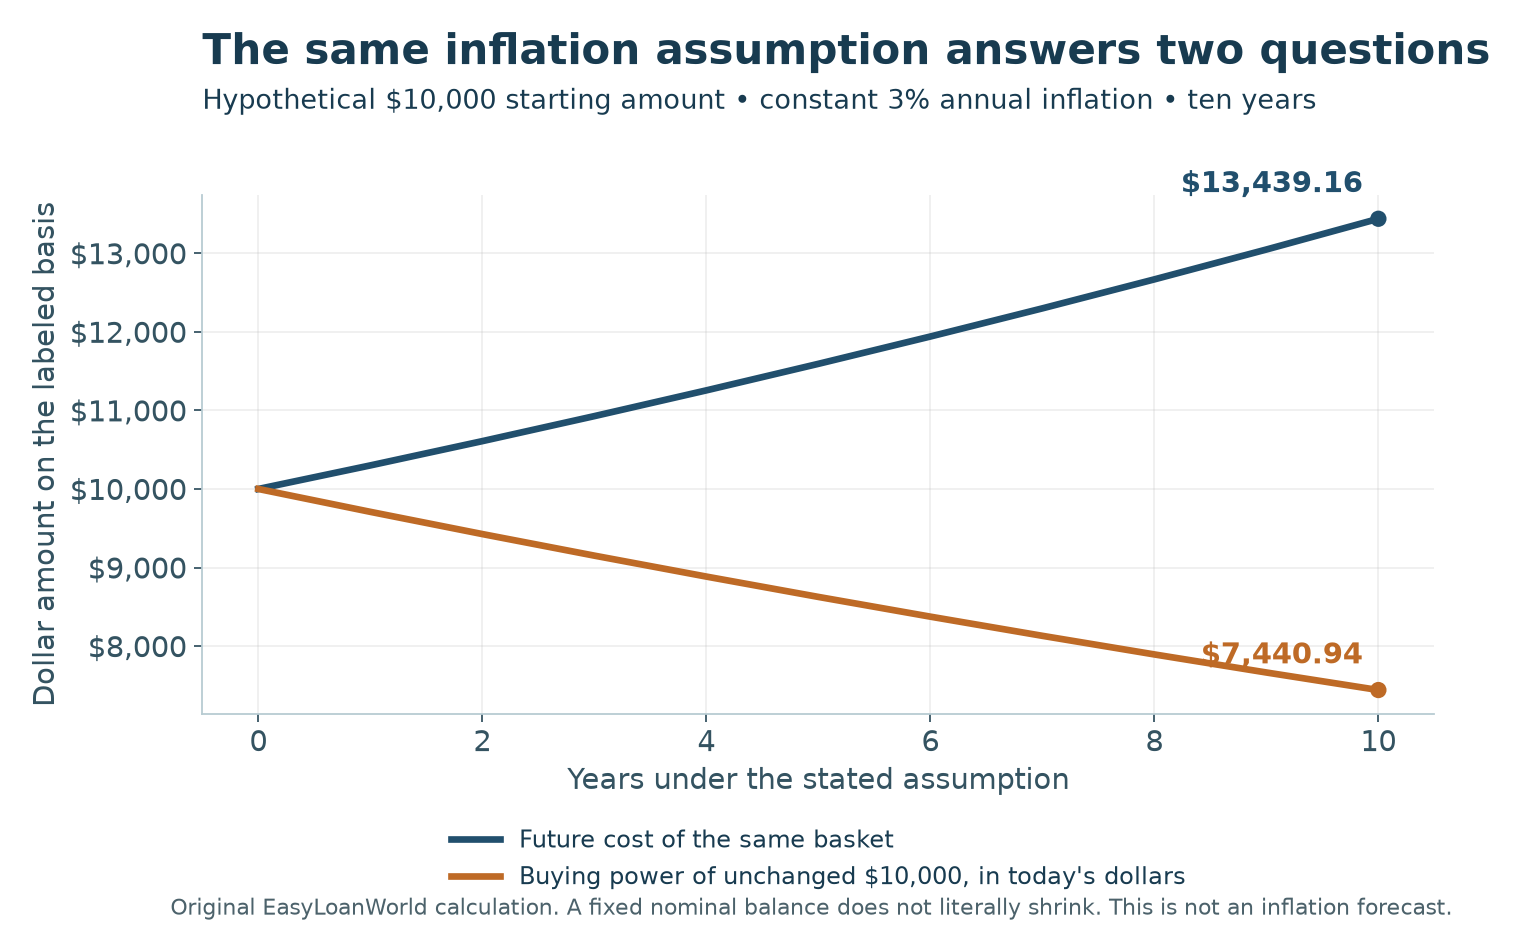
At an illustrative 3% each year for ten years, the factor is 1.0310, or about 1.343916. That factor applies to the same assumed basket of goods or purchasing power throughout the example.
| Measure | Result |
|---|---|
| Starting amount | $10,000.00 |
| Future cost of equivalent purchasing power | $13,439.16 |
| Increase in equivalent cost | $3,439.16 |
| Cumulative assumed inflation | 34.39% |
| Future purchasing power of unchanged $10,000 | $7,440.94 in today’s dollars |
The future-cost result says that a basket costing $10,000 today would require about $13,439.16 in ten years under the assumption. The purchasing-power result says that keeping exactly $10,000 without growth would then buy the equivalent of about $7,440.94 today. It doesn’t mean the account’s nominal balance literally falls to $7,440.94.
A price increase and a purchasing-power loss use different bases
In the example, prices rise by 34.39%, but unchanged cash loses about 25.59% of its purchasing power. Those percentages aren’t supposed to match. The price increase compares the new cost with the old cost. The purchasing-power loss compares the original cash’s later buying ability with its earlier buying ability.
A simple doubling example makes the distinction clear. If prices double, the increase is 100%, while a fixed dollar amount buys half as much, a 50% loss of purchasing power. Subtracting cumulative inflation directly from a cash balance would therefore give the wrong adjustment.
Likewise, a lower positive inflation rate means prices are rising more slowly, not necessarily falling. A change from a 4% assumption to 2% still produces a growing price level. A negative rate represents a falling modeled price level and reverses the direction of the two dollar outputs.
Compare a range instead of one distant estimate
Hold the $10,000 starting amount and ten-year horizon constant, then change only the annual assumption. The resulting range makes the sensitivity easier to understand than a single forecast-like number.
| Annual inflation assumption | Future equivalent cost |
|---|---|
| 2% | $12,189.94 |
| 3% | $13,439.16 |
| 4% | $14,802.44 |
Extending the 3% assumption to 20 years produces about $18,061.11. The longer horizon increases the effect of compounding. That’s useful for planning, but it also makes the result more dependent on a rate that can’t be known with certainty for every future year.
For a near-term expense, obtain an actual quote when possible. For a distant goal, use scenarios and update them periodically. A general inflation assumption shouldn’t replace better information about the particular cost you’re trying to fund.
A future annual expense is also different from the sum of expenses paid along the way. If $10,000 represents one year’s current spending, the ten-year future-cost output estimates that annual spending level at the selected future date. It doesn’t total all ten intervening years of bills. A multi-year spending plan needs a separate amount for each year and a sum of those cash flows.
Label the timing in any budget where you copy the result. “Annual expense in year ten” and “cash needed over the next ten years” are different planning questions. The same distinction applies to a salary target, an insurance premium, or a recurring service cost.
How this differs from a historical CPI calculator
The Bureau of Labor Statistics describes CPI in its CPI questions and answers and concepts documentation. CPI measures price changes for a defined consumer basket and population. It isn’t a precise record of every household’s personal spending experience.
A historical CPI adjustment uses observed index values for specified periods. BLS’s CPI math guide explains the index-ratio approach. This tool instead repeats one user-entered annual rate. Entering a rate doesn’t cause it to retrieve the index levels for any particular start and end date.
If you need a historical comparison, identify the appropriate index series and dates, and use the observed ratio. If you need a future planning scenario, identify the assumed rate and horizon. Keeping those purposes separate prevents a hypothetical projection from being presented as a measured historical fact.
Your expenses may move differently from a broad index
A household’s mix of housing, transportation, healthcare, education, food, and other spending can differ from an index basket. A single future expense can also change for reasons beyond general inflation, such as a different service level, location, or quantity purchased. This inflation calculator assumes the same purchasing-power question throughout; it doesn’t model those changes.
For a personal budget, consider projecting large categories separately when you have credible information. Keep quantity changes distinct from price changes. Spending more because you expect to support another person isn’t the same as paying more for an unchanged basket, even though both increase the future cash requirement.
Use the savings-goal calculator after choosing the future dollar target. Make sure the target is labeled as future dollars so it isn’t adjusted for inflation twice. If the goal was already increased to reflect expected prices, applying the same inflation factor again would overstate the required amount.
Compare growth and inflation on consistent terms
An account can grow in nominal dollars while making less progress in purchasing power. If a balance earns an effective annual 5% while prices rise an assumed 3%, the one-year real growth factor is 1.05 ÷ 1.03. The corresponding real increase is about 1.94%, before any taxes or costs not already reflected in the return.
Simply subtracting rates is an approximation, not the exact compounded relationship. Keep annual nominal rates, effective annual yields, and inflation assumptions clearly labeled. The nominal-rate to APY calculator explains compounding conventions, while the retirement savings calculator shows a projected balance in both nominal and today’s-dollar terms.
No return is assumed here. The unchanged-cash output deliberately answers what happens to a fixed number of dollars under the selected price path. Use a separate growth model when the balance itself is expected to change.
Inflation calculator questions
Is 3% the current inflation rate?
No. It’s an illustrative default. The inflation calculator uses the rate you enter and doesn’t fetch current or historical inflation data.
Why are there two dollar results?
One estimates the future cost of today’s purchasing power. The other estimates the later buying power of unchanged cash in today’s dollars. Multiplication and division answer those different questions.
Can I model deflation?
A supported negative annual rate models a falling price level. The rate must remain above negative 100% so the price factor stays positive.
Does this calculate my personal cost of living?
No. It applies one constant rate to one amount. Your actual spending mix, quantities, location, and individual prices require a more specific budget.
Questions or corrections?
Send a question or report an issue with a published page.