GDP Revised? Choose the Right Version Before Comparing Growth
Match the GDP version to the question before comparing headlines.

Estimated reading time: 5 minutes
A revised GDP headline can describe the same quarter as an earlier headline, not another quarter of growth. Before comparing the figures, decide whether you want today’s estimate of the past or the information available when a past decision was made.
Third doesn’t mean permanently final
BEA’s GDP release notes describe three initial estimates: advance, second and third. The advance estimate uses incomplete or revisable source data; subsequent estimates incorporate more detailed information. Annual updates and periodic comprehensive updates can revise history again, including improvements in methods and definitions.
Consequently, “third estimate” identifies a publication stage, not a guarantee that a number will never change. Preserve both the reference quarter and the release date. A later publication date doesn’t turn an estimate of an earlier quarter into economic activity occurring on publication day.
Choose the question before choosing the file
The St. Louis Fed describes ALFRED as an archive of historical versions, or vintages, of FRED data. These versions let a researcher distinguish an earlier information set from a later account of the same period. An archived number need not match today’s historical series.
| Question | Version check |
|---|---|
| What is the current historical estimate? | Use a consistent current series. |
| What could a reader know then? | Use information released by that date. |
| How much was one quarter revised? | Compare that quarter across identified versions. |
For example, evaluating an old forecast against subsequently revised data answers a different question from evaluating it against the first reported outcome. State the chosen benchmark; don’t quietly substitute one for the other midway through a comparison.
Suppose a manager wrote a dated planning memo before a later GDP revision appeared. Reviewing that memo with the later number can help assess the outcome, but it can’t show that the manager had that number available. Keep a copy of the contemporaneous release with the memo and label later evidence separately. This distinguishes evaluating a result from reconstructing the information behind a decision.
Annualized growth isn’t a full year’s observation
BEA’s annual-rate explanation compounds a quarterly growth rate over four quarters. It describes the rate implied if that quarter’s pace continued, not a forecast or the measured change over the preceding year.
Use fictional, consistently measured index levels of 100 in Quarter A and 101 in Quarter B. The observed quarter-to-quarter change is 1%. Its compounded annual rate is [(101 ÷ 100)4 − 1] × 100 = 4.060401%, or approximately 4.1% rounded to one decimal.
Multiplying 1% by four gives 4%, a simple approximation, not this exact compounded conversion. Neither result means the index actually rose 4% during Quarter B. These teaching inputs aren’t U.S. GDP observations.
A year-over-year comparison instead needs the same quarter one year earlier. The two supplied levels don’t contain that observation, so they can’t establish that rate. Keep the comparison period attached to the percentage rather than calling every number “annual growth.”
Rule out a price-basis mismatch
BEA’s real-versus-current-dollar explanation distinguishes inflation-adjusted quantity from market value reflecting both prices and quantities. Current-dollar GDP can fall while real GDP rises if price declines outweigh an increase in quantity.
Therefore, two headlines with different signs aren’t necessarily conflicting versions of the same measure. First confirm whether both describe real GDP. A nominal figure and a real figure can’t be treated as a revision pair merely because their quarter labels match.
This guide doesn’t calculate a GDP price index, combine chained-dollar components or estimate a business’s own price changes. Its narrower purpose is to prevent a definition mismatch from being mislabeled a revision.
Leave a reproducible trail
Save the source file separately from your working notes. In the notes, record the exact table and row, observation quarter, publication date, units, seasonal treatment and growth convention. A filename containing “latest” won’t explain which release you used after a later download replaces it.
If two saved files disagree, write down the question before editing the chart. Is one a different release, a different measure, or a different calculation? Locate the relevant source note and preserve its explanation. Don’t invent a cause from the direction of the revision alone.
Keep an explicit change log: original figure, replacement figure, source reference and reason for replacement. If the reason remains unresolved, label it unresolved. This is more useful than overwriting a cell and leaving a chart whose caption no longer describes its inputs.
For business planning, keep national economic context separate from your actual orders, collections and payment obligations. This exercise supplies no sales forecast, lending decision or investment recommendation. A correctly labeled macroeconomic statistic still doesn’t establish a particular firm’s future cash flow.
General U.S. financial-data education. Sources checked October 29, 2026. No current GDP growth estimate is asserted; the index exercise is fictional.
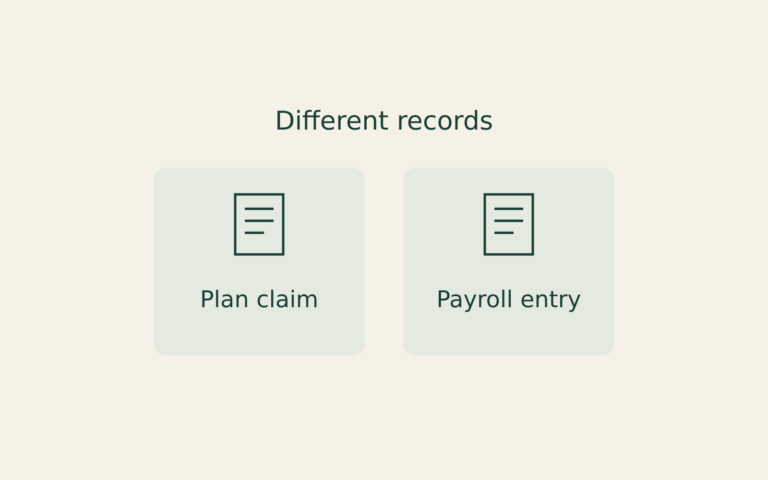
Deferred Compensation
A deferred-compensation statement and payroll form can describe different rights and events.
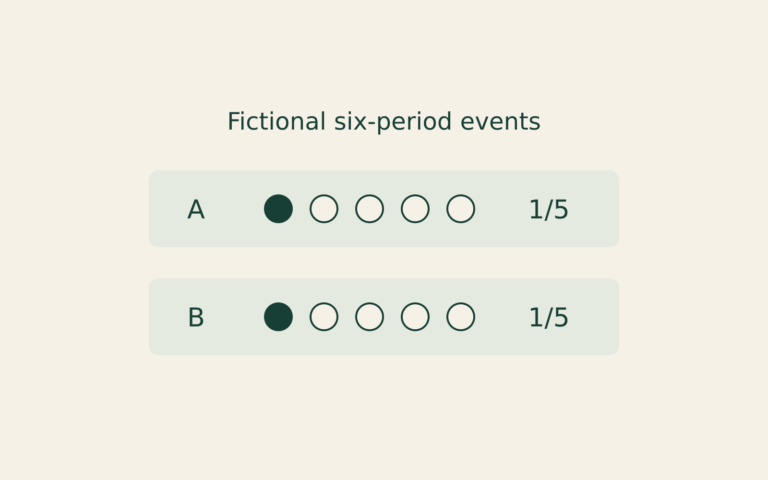
Loan Horizons
A smaller cumulative missed-payment count can reflect a shorter observation window. This fictional record exercise compares equal payment ages instead.
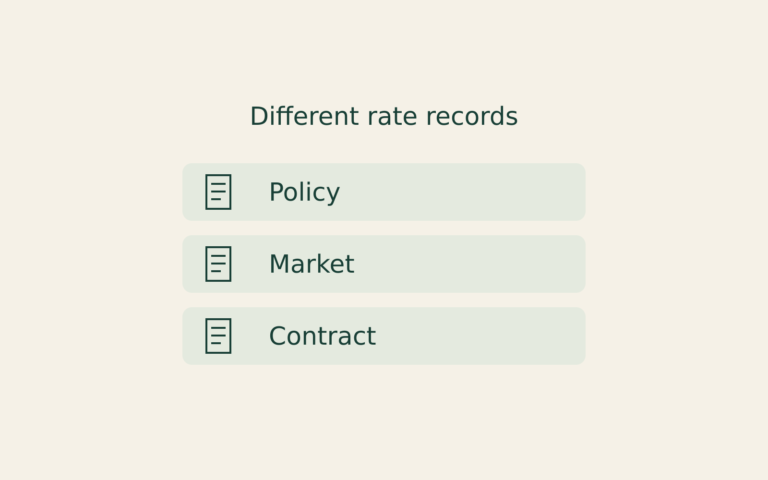
Rate Transmission
A rate announcement, a market yield and a contract reset describe different links between monetary policy and borrowing costs.