Average Hourly Earnings vs. ECI: What Changed?
A higher average does not establish an individual raise. Match labor-cost measures before using them in a business forecast.
Estimated reading time: 5 minutes
A headline about average hourly earnings doesn’t establish the raise received by a particular employee. Before using a wage statistic in a business forecast, identify whether it describes average earnings, a change in employer labor costs or a dollar cost level. Those are different questions.
Average hourly earnings aren’t a wage schedule
The Bureau of Labor Statistics’ Current Employment Statistics survey reports monthly average hourly earnings for private nonfarm employment. It doesn’t publish government hours or earnings. Its earnings measure reflects gross payroll relative to hours, rather than the contractual rate for a particular job.
Overtime pay is included. Average hourly earnings aren’t total employer compensation: benefits and the employer’s payroll-tax share, among other items, are excluded. An earnings percentage therefore shouldn’t be applied indiscriminately to every line of a fully loaded staffing budget. BLS CES FAQ.
An average can rise without a rate increase
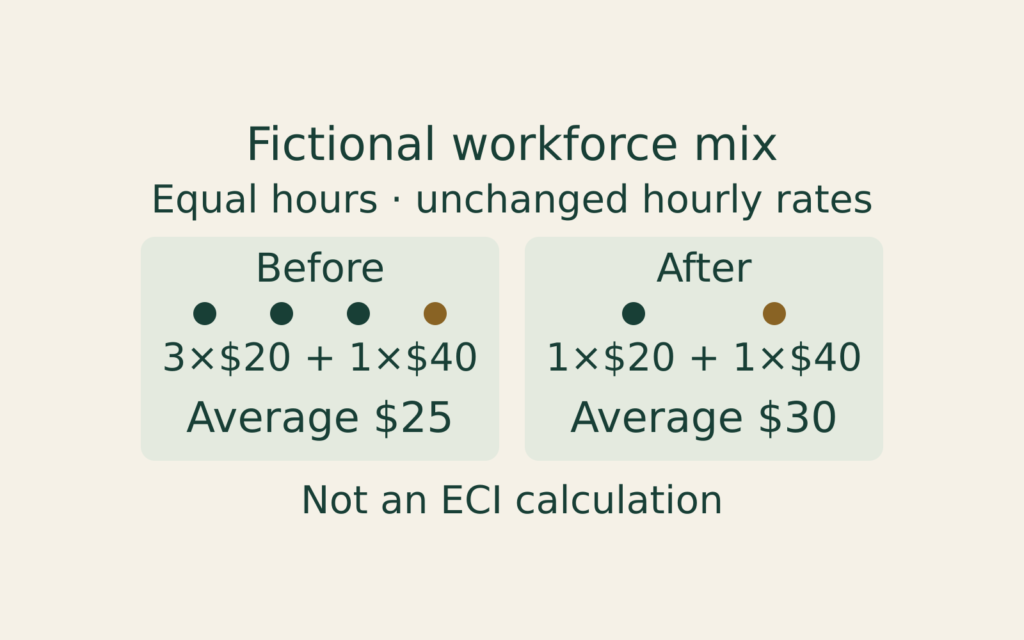
BLS explains that workforce composition can affect average hourly earnings. Here’s a deliberately simplified illustration, not a reconstruction of the national survey. Everyone works equal hours; there’s no overtime, bonus or benefit cost. Hourly rates stay unchanged.
| Hourly rate | Before: workers | After: workers |
|---|---|---|
| $20 | 3 | 1 |
| $40 | 1 | 1 |
The first average is (3 × $20 + $40) ÷ 4 = $25. The second is ($20 + $40) ÷ 2 = $30. The average rises 20%, although neither rate increases. Two lower-paid workers leaving changes the mix.
This arithmetic doesn’t show why anyone left or explain an actual economic release. It shows why “average earnings rose” and “everyone received a raise” aren’t equivalent statements. BLS analysis of composition effects.
The ECI holds a different thing steady
The Employment Cost Index, or ECI, measures labor-cost changes using fixed employment weights across industry and occupation categories between reweightings. This reduces the influence of workers shifting between those categories on the measured change.
That doesn’t mean BLS follows the identical individual employees forever. Its calculation uses matched job observations within sampled establishments. BLS explicitly distinguishes tracking establishment jobs from tracking individual workers. The measure isn’t a longitudinal record of each person’s pay raise.
Nor is the small table above an ECI calculation. The official index uses detailed categories, survey weights and other statistical procedures absent from the example. Use the illustration to understand a composition problem, not to manufacture an official-looking alternative index. BLS ECI calculation methods.
Match the compensation component and population
ECI publishes separate wage-and-salary, benefit and total-compensation measures. Total compensation includes both wages and benefits. Its civilian coverage combines private industry with state and local government; it isn’t a measure including all federal employees or self-employed people.
For a private-business question, a private-industry series avoids silently substituting the broader civilian population. Also distinguish current-dollar changes from constant-dollar changes adjusted for consumer prices. A real compensation measure answers a purchasing-power-related question, not simply how many nominal dollars appear in a payroll forecast. BLS ECI concepts.
An index point isn’t an hourly dollar
BLS explains that an ECI index value is relative to a base period, not a dollar cost level. A three-month percentage compares consecutive quarterly reference periods; a twelve-month percentage compares the same reference month a year apart. Neither is automatically an annual-average change.
Keep the seasonal-adjustment label too. Mixing an adjusted quarterly change with an unadjusted annual comparison without identifying the difference makes the conclusion ambiguous. For average employer costs in dollars per hour worked, BLS points readers to Employer Costs for Employee Compensation, a different product.
Not every ECI subgroup has the same fixed-weight structure. BLS cautions that fixed employment weights are unavailable for certain series, including geographic and bargaining-status groups, so these can’t be compared directly with aggregate industry and occupational series. A familiar label alone doesn’t establish comparability; read the methodology for the particular subgroup before combining it with another series.
Record the exact series title, component, population, period and unit before copying a value. A nearby chart with a similar title may answer another question. BLS index-reading guide.
Use evidence to label the forecast assumption
Separate three entries in a planning file: the published observation, the business’s proposed assumption and the internal evidence supporting that assumption. A national statistic can provide context without becoming an automatic instruction to change compensation.
Write down who selected the assumption and what would trigger its review. Keep the source excerpt or table reference with the retrieval date so another reviewer can reproduce the comparison. If an assumption changes, preserve the earlier version and explain why.
No current wage estimate, recommended pay increase or forecast of borrowing rates is supplied here. The useful outcome is a clearly defined comparison, not a percentage that appears precise while answering the wrong question.
Deferred Compensation
A deferred-compensation statement and payroll form can describe different rights and events.
Loan Horizons
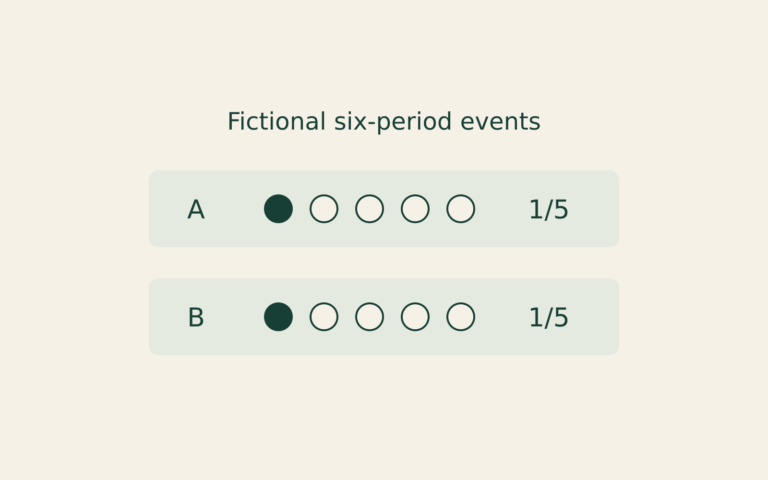
A smaller cumulative missed-payment count can reflect a shorter observation window. This fictional record exercise compares equal payment ages instead.
Rate Transmission
A rate announcement, a market yield and a contract reset describe different links between monetary policy and borrowing costs.