College Outcome Records
Compare college completion, earnings, employment and repayment statistics. Their different reporting populations don’t provide a personal forecast.

Estimated reading time: 5 minutes
Before borrowing for college, separate completion, employment and repayment statistics. These reporting methods describe different populations, rather than one personal forecast.
Check which IPEDS completion measure you’re reading
The National Center for Education Statistics separates Graduation Rates from Outcome Measures in its Integrated Postsecondary Education Data System (IPEDS) comparison. Graduation Rates follows full-time, first-time degree- or certificate-seeking undergraduates. Outcome Measures also includes part-time and non-first-time students. It uses a full-year entering cohort, July 1 through June 30, rather than assuming everyone at an institution began in one fall term.
Outcome Measures groups students by Pell Grant status, attendance intensity and first-time status. It records the highest credential earned at four, six and eight years, and reports enrollment status at eight years. That differs from the Graduation Rates measure of completion within 150% of normal program time. Check the survey component before interpreting whose progress an IPEDS result follows.
Keep completion at another institution visible
The National Student Clearinghouse Research Center’s 2025 Yearly Progress & Completion methodology follows first-time, degree-seeking college entrants across institutions. Its studied fall-entry cohorts run from 2008 through 2019, with progress followed for up to eight years. Completion means an undergraduate certificate, associate degree or bachelor’s degree at any institution within the study period.
The method assigns only one outcome category per student per academic year. A credential from the starting institution takes priority. Otherwise, a credential completed elsewhere can put the student in the different-school completion category. A later credential at the starting school can change that classification.
“Not enrolled” isn’t a permanent outcome. A student can return and appear as enrolled in a later year. Use the report’s definition of that annual status, rather than automatically describing the person as a permanent dropout.
Check who appears in graduate earnings tables
The Census Bureau’s June 2023 Post-Secondary Employment Outcomes technical documentation covers graduates of participating institutions, rather than everyone who enrolled. Its earnings estimates impose two labor-market conditions: earnings above the equivalent of 35 hours weekly for 50 weeks at the federal minimum wage, and positive earnings in at least three quarters of the measurement year.
The document also separates earnings from employment-location tabulations. Earnings include all jobs, while employment characteristics use the highest-earning job for the year. Industry and geography come from the highest-earning quarter with that employer.
Its first post-graduation year is the first calendar year after graduation. It isn’t the following twelve months beginning on commencement day. These are measurement rules in the dated documentation; they don’t establish a borrower’s future salary or an individual graduate’s employment history.
Separate education-wide wages from a school result
The Bureau of Labor Statistics’ Current Population Survey earnings page offers a different comparison. Its education breakdown covers wage and salary workers aged 25 and older. The linked median weekly earnings chart covers full-time workers. That population isn’t a graduating class from one university or a single program.
CPS earnings are measured before taxes and other deductions and include overtime, commissions and tips usually received. All self-employed people are excluded, including those running incorporated businesses. The earnings information comes from one-fourth of the CPS household sample and is published quarterly.
Keep the worker and earnings labels with an educational-attainment chart. Don’t relabel a weekly, before-deduction measure as a new graduate’s monthly take-home pay when preparing a loan-payment budget.
Check how the report classifies underemployment
The New York Fed’s college labor-market feature defines underemployment by whether a graduate’s job typically requires a college degree. It uses O*NET survey information to help classify jobs. Working fewer hours than desired isn’t, by itself, this definition.
The analysis covers people with at least a bachelor’s degree, including graduate and professional degree holders. It doesn’t cover associate degrees or technical certificates. Its early-career category is ages 22–27; mid-career means ages 35–45. The figures are national, rather than limited to the New York region.
The feature’s “Share with Graduate Degree” field covers workers with a given bachelor’s major who also hold a graduate degree of any kind. It doesn’t mean every graduate degree is in the original undergraduate major.
Keep the repayment cohort and policy context together
Federal Student Aid’s September 30, 2026 briefing defines the FY 2023 school cohort default rate using borrowers entering repayment from October 1, 2022 through September 30, 2023, and defaults through September 30, 2025. It includes specified Direct Loan and Federal Family Education Loan borrowers, rather than every enrolled student.
The agency explicitly warns that the federal payment pause significantly affected this rate. Borrowers with Department-held loans didn’t enter default during the pause. The result may therefore give an overly favorable picture of repayment.
The same briefing describes a separate nonrepayment measure: Direct Loan borrowers entering repayment between January 2020 and May 2025 whose loans were more than 90 days delinquent, updated through August 2026. Keep that population and delinquency threshold separate from the FY 2023 default-rate cohort.
Deferred Compensation
A deferred-compensation statement and payroll form can describe different rights and events.
Loan Horizons
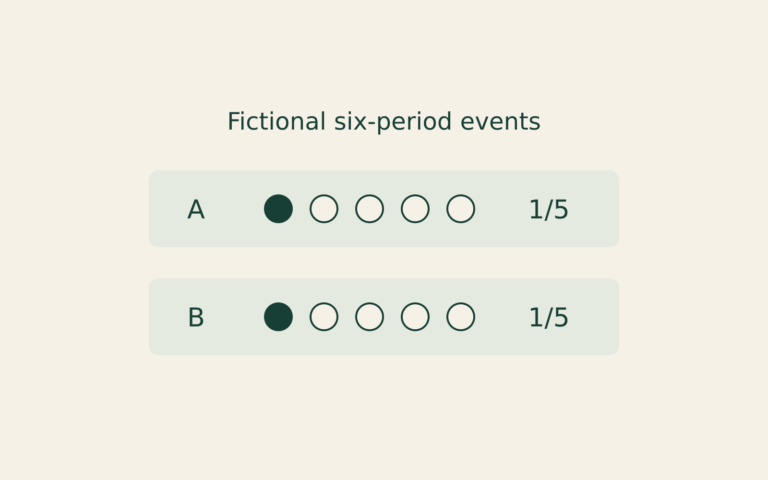
A smaller cumulative missed-payment count can reflect a shorter observation window. This fictional record exercise compares equal payment ages instead.
Rate Transmission
A rate announcement, a market yield and a contract reset describe different links between monetary policy and borrowing costs.