Group Averages
The same group averages can accompany opposite directions of association in the underlying records.
Estimated reading time: 5 minutes
The same group averages can accompany opposite directions of association in the underlying records. A fictional income-and-debt example identifies the missing information.
Keep the groups fixed and change only the pairing
Construct four records in two groups of equal size. X is income over one year; Y is outstanding debt at its end. Both are measured in thousands of dollars. Group membership is fixed, not defined by nonoverlapping income bands. These are invented descriptive records, not actual borrowers or a qualification test.
Dataset M pairs the larger income with the larger debt within each group. Dataset S swaps the two debt values inside each group, leaving every income and group membership unchanged.
| Group | Income X | Debt M | Debt S |
|---|---|---|---|
| 1 | 10 | 0 | 40 |
| 1 | 90 | 40 | 0 |
| 2 | 60 | 20 | 60 |
| 2 | 140 | 60 | 20 |
In either dataset, Group 1 has mean income 50 and mean debt 20. Group 2 has mean income 100 and mean debt 40. The group with higher average income therefore also has higher average debt in both datasets.
The overall means are also identical: income 75 and debt 30. Even the complete lists of separate values are unchanged. Income is 10, 60, 90 and 140; debt is 0, 20, 40 and 60. What differs is which debt value belongs with which income inside each group.
Calculate association in the complete records
For this exercise, define a descriptive measure: subtract the overall income mean from each income, subtract the overall debt mean from its paired debt, multiply those deviations, and average the four products. Divide by four because the object being described is this complete four-record construction, not an estimator for an unknown population.
A positive product arises when both deviations have the same sign; a negative product arises when their signs differ. The average summarizes that direction across these records. Its units are squared thousands of dollars, not a percentage, probability or amount available to spend.
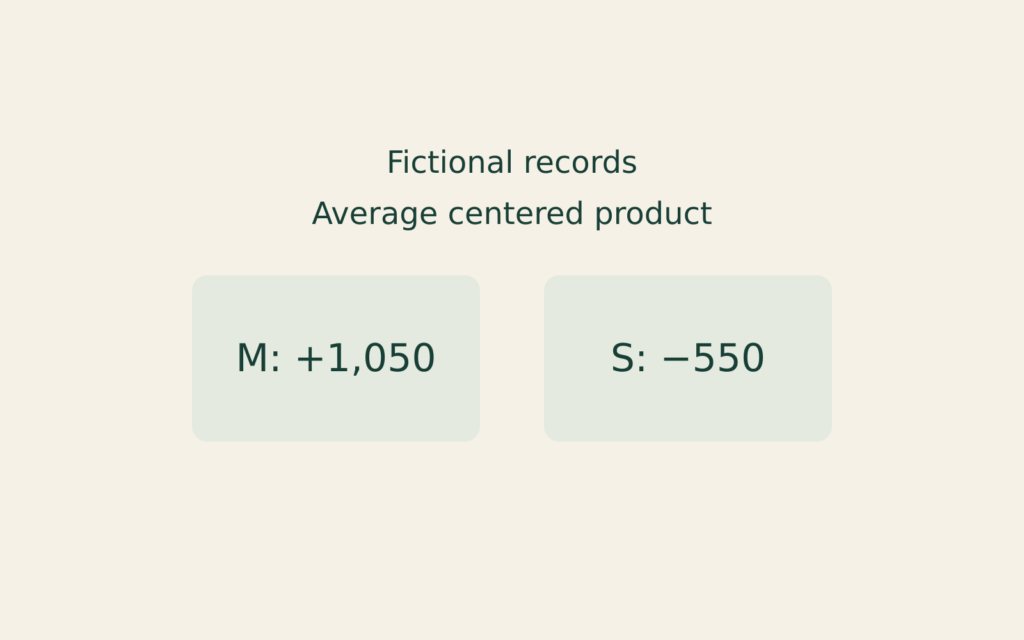
For M, the products are (10 − 75)(0 − 30) = 1,950; (90 − 75)(40 − 30) = 150; (60 − 75)(20 − 30) = 150; and (140 − 75)(60 − 30) = 1,950. Their sum is 4,200, giving an average centered product of +1,050.
For S, the corresponding products are −650, −450, −450 and −650. Their sum is −2,200, giving an average of −550. Thus the record-level measure changes sign, although neither the group means nor the separate lists of incomes and debts changed.
Separate the within-group and between-group pieces
Inside each group, incomes sit 40 below or 40 above their own group mean. In M, paired debts sit 20 below or 20 above their group mean in the same order. Both within-group products are therefore +800. Each group’s within-group average is +800.
In S, the debt deviations switch order. Each product becomes −800, so both within-group averages are −800. This is the information lost when only the two means for each group are retained.
The between-group part does not change. Group 1’s means are 25 and 10 below the overall means, giving (−25)(−10) = 250. Group 2’s means are 25 and 10 above, also giving 250. With equal group sizes, their weighted average remains +250.
Consequently, M’s complete-record result is +800 + 250 = +1,050. S’s is −800 + 250 = −550. The positive between-group component is identical; a sufficiently negative within-group component outweighs it in S.
Swapping just Group 1 gives an intermediate check. Its within-group average is −800 while Group 2 remains +800, so the equally weighted within component is zero. Adding the unchanged between component yields +250. One swap changes the measure without reversing its sign; both swaps produce the negative result.
Why those two components add exactly
Write each income’s deviation from the overall mean as two parts: its deviation from its group mean, plus that group mean’s deviation from the overall mean. Make the same split for debt. Multiplying the two sums produces four terms.
One term multiplies the two within-group deviations. Another multiplies the two group-mean deviations. The remaining two terms each multiply a within-group deviation by a constant group-mean deviation.
Within a group, deviations from its own mean sum to zero. Those two mixed terms therefore average to zero. What remains is the within-group average centered product plus the between-group product, combined across groups using their shares of the records.
Here each group contains two of four records, so each receives weight one-half. Unequal group sizes would require different record-share weights; simply averaging their summaries equally would describe a different calculation.
Limit the inference to the information retained
The abstract of David Freedman’s 1999 Berkeley report on ecological inference identifies the ecological fallacy as assuming that relationships observed for groups necessarily hold for individuals. This construction supplies a specific counterexample, not a claim that every grouped analysis is invalid. Group means alone do not determine the direction of the complete-record association shown here, much less establish causality or an individual borrower’s repayment capacity.
Deferred Compensation
A deferred-compensation statement and payroll form can describe different rights and events.
Loan Horizons
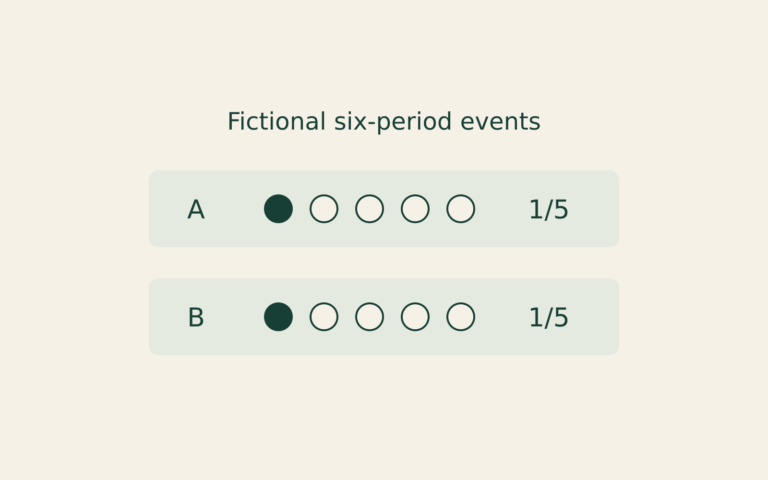
A smaller cumulative missed-payment count can reflect a shorter observation window. This fictional record exercise compares equal payment ages instead.
Rate Transmission
A rate announcement, a market yield and a contract reset describe different links between monetary policy and borrowing costs.