Retail Sales Headlines: Dollars, Coverage and the Online Share
Read Census retail dollars and the e-commerce share without confusing sales value, product demand and market coverage.
Estimated reading time: 5 minutes
A stronger retail-sales headline doesn’t automatically mean more items left the shelves. Before using it in a business forecast, separate sales dollars, the businesses covered and the meaning of the online share.
Seasonal adjustment isn’t price adjustment
The Census retail and food services release adjusts its headline estimates for seasonal variation and holiday and trading-day differences, but not price changes. “Adjusted” therefore doesn’t mean inflation has been removed.
For an invented one-product illustration, 100 unchanged items sold at $20 produce $2,000. Selling the same 100 items at $22 produces $2,200. Sales dollars rise 10%; item volume doesn’t rise. This is arithmetic under stated assumptions, not a Census observation, inflation estimate or recommendation to raise prices.
A national dollar increase alone can’t tell you that your own customer orders will increase by the same percentage.
A store category isn’t a product total
Census definitions explain that sales by type of retail establishment aren’t intended to measure all sales of a particular merchandise line. A product sold by several different types of businesses doesn’t belong entirely to one familiar store label.
The reported sales concept also differs from an unexamined register total. It includes sales for cash or credit, deducts refunds and allowances for returned merchandise, and excludes sales taxes collected directly from customers for tax agencies. Certain passed-through excise taxes are included.
For a business comparison, document whether your internal measure uses the same treatment. Don’t call a difference market-share growth until you understand both numerators. Nor should a retail category be relabeled as the whole consumer economy: the establishment’s principal activity determines the survey’s coverage.
Census also identifies sampling and nonsampling error. A reported estimate isn’t a complete census of every transaction. Reporting mistakes, interpretation differences and missing responses can affect results alongside sample variability. Preserve the report’s reliability information instead of treating every small difference as an established change in business conditions.
Check what the monthly headline includes
The advance-survey FAQ describes retail trade and food services coverage. Food services include businesses preparing meals, snacks and beverages for immediate consumption, on or off the premises.
Sales to business customers aren’t automatically removed from a qualifying retail establishment’s reported sales. Consequently, “retail” shouldn’t be translated into “every dollar was spent by a household.”
MARTS is designed as a national indicator. Its national change doesn’t supply your city’s sales change or a particular shop’s order book. Keep local evidence separate instead of attaching a neighborhood label to the national percentage.
Online describes the transaction, not just the seller
The quarterly e-commerce FAQ defines qualifying transactions by online ordering or online negotiation of the price and terms. Payment need not occur online. An online payment alone is therefore not the defining test.
The survey includes traditional retailers selling online as well as online-only businesses. Conversely, nonstore retail methods can include paper catalogs, door-to-door selling or vending machines. Don’t substitute a store-format label for the e-commerce transaction definition.
The quarterly report covers retail trade, not the monthly headline’s additional food-services sector. It excludes non-retail activities such as travel, ticketing and financial services. Thus its online share isn’t the percentage of every kind of consumer spending conducted on the internet.
Use the report’s own retail denominator. A restaurant-sales figure from another series doesn’t belong in that calculation merely because restaurant orders can be placed online.
The online amount is part of the total
The quarterly release reports e-commerce as a share of total retail sales. The two amounts aren’t separate pools to add.
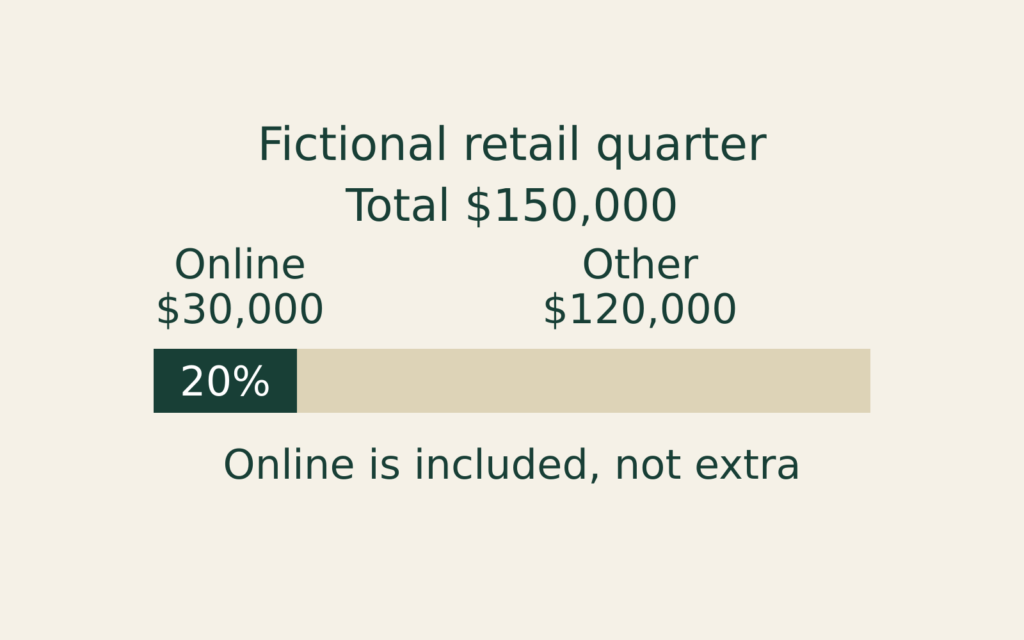
In this complete fictional quarter, use unadjusted classroom figures, not published estimates:
| Component | Sales |
|---|---|
| E-commerce | $30,000 |
| Other retail sales | $120,000 |
| Total | $150,000 |
The share is $30,000 ÷ $150,000 = 20%. Adding $30,000 to the total would double-count that component. The example supplies no profit, transaction count or customer count. Match the quarter and adjustment basis when comparing actual report entries.
Also read release notices. The page retrieved for this guide explicitly warned that its displayed estimates were no longer the most up to date. This article uses no reported latest-quarter amount or share.
Write the business question before choosing the series
A useful research note starts with a decision question: are you investigating product demand, a sales channel or the company’s own cash requirements? Write down what evidence would answer it before importing a convenient headline.
Keep the source title, table, period and observation date beside any figure you retain. Separate the published information from your calculation and from an assumption that still needs testing. Label an unresolved comparison rather than silently changing its definition to make the numbers fit.
These checks support research; they don’t predict sales, establish borrowing capacity or recommend inventory purchases. Census sources checked October 29, 2026.
Deferred Compensation
A deferred-compensation statement and payroll form can describe different rights and events.
Loan Horizons
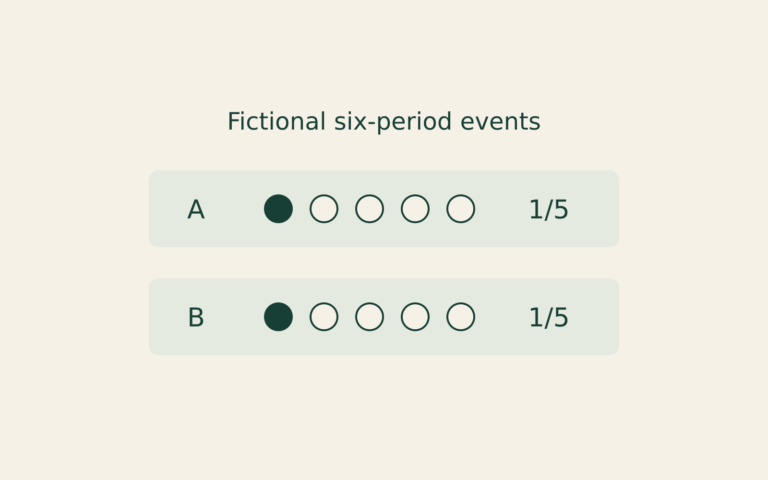
A smaller cumulative missed-payment count can reflect a shorter observation window. This fictional record exercise compares equal payment ages instead.
Rate Transmission
A rate announcement, a market yield and a contract reset describe different links between monetary policy and borrowing costs.