SLOOS Net Tightening: Same Net, Different Responses
Understand what SLOOS net tightening measures, why identical net figures can hide different bank responses, and how to use a lending headline without treating it as an approval forecast.

Estimated reading time: 9 minutes
SLOOS net tightening is the share of responding banks that tightened standards minus the share that eased them. A net figure of 20 percentage points doesn’t mean only 20% tightened, and it doesn’t give your chance of getting a loan. The two simple panels below show why the underlying shares matter.
Historical survey context
The January 2026 Senior Loan Officer Opinion Survey (SLOOS) generally covered fourth-quarter 2025 changes, not today’s conditions. Standards are approval policies; terms are conditions on approved loans. Net tightening subtracts easing from tightening shares, pooling degrees within each direction. Net demand subtracts weaker from stronger responses. Unchanged policies may already be restrictive.
Sources: Federal Reserve historical release; Table 1 questions.
What a borrower can use this information for
Use a survey headline to prepare better lender questions. First identify the loan category and period: a historical business-loan survey doesn’t describe today’s mortgage offer. Then ask the lender about the actual product’s documentation, collateral, loan size, repayment period and pricing.
Keep three notes alongside any headline: what the survey measures; what has changed in your lender’s written terms; what remains unknown about your application. The survey can provide context for the first note. The lender’s current offer and your own evidence are needed for the other two.
For a quick understanding, read Panels A and B. The later sections are optional deeper exercises explaining unchanged responses, intensity, respondent counts and missing answers.
Imagine a headline: “A net 20% of banks tightened standards.” Can you tell how many banks chose each response? Try rebuilding the headline from two different sets of answers.
Every panel below is fictional, unweighted and complete: 100 banks answer the same hypothetical loan-category question for the same period, and each bank is counted once. These are invented classroom exercises, not Federal Reserve survey results.
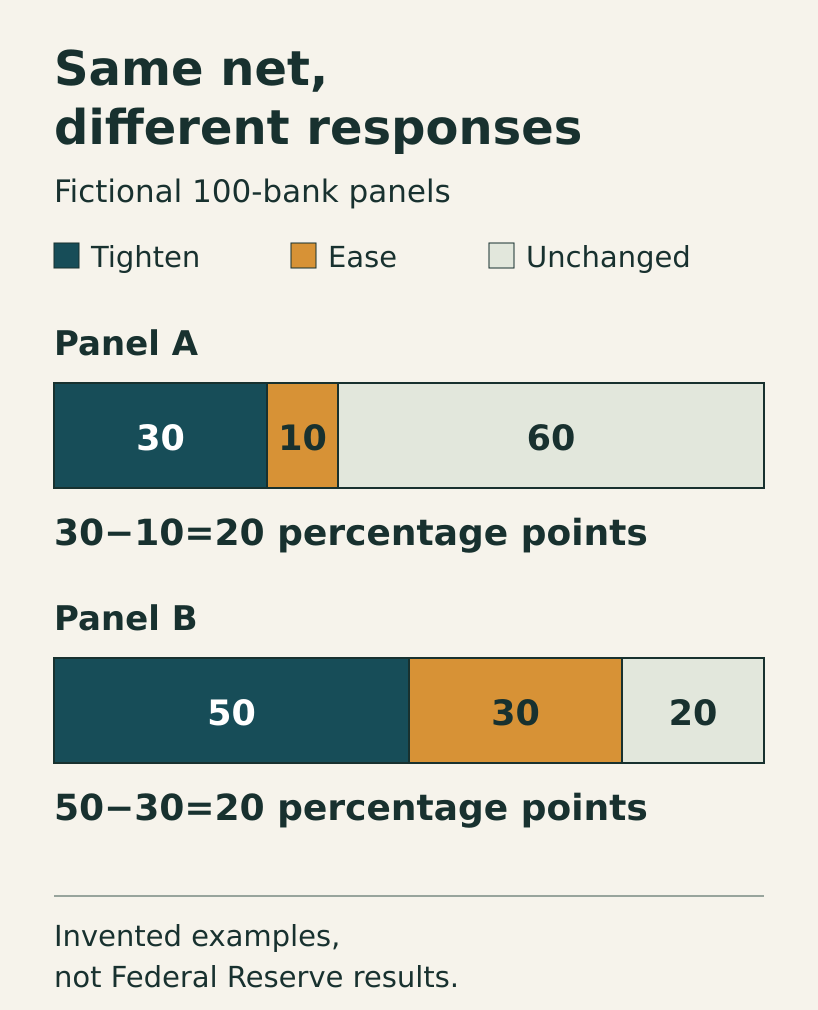
SLOOS net tightening: Panel A’s 100 answers
- 30 banks tighten.
- 10 banks ease.
- 60 banks report no change.
The total is 30 + 10 + 60 = 100. With this denominator, the first two groups represent 30% and 10% of the panel.
30% − 10% = +20 percentage points.
The 30% tightening share and the 20-point difference are different quantities. The subtraction removes the opposing share; it doesn’t erase the ten banks that eased or turn thirty tightening banks into twenty.
Panel B: keep the answer, change the ingredients
- 50 banks tighten.
- 30 banks ease.
- 20 banks report no change.
Again, 50 + 30 + 20 = 100. This time the subtraction is 50% − 30% = +20 percentage points.
Panel A has 40 banks reporting a change in either direction: 30 + 10. Panel B has 80: 50 + 30. Both yield the identical 20-point difference, even though twice as many banks report a change in B.
That’s the information lost by subtraction. Given only +20, you can’t choose between 30/10/60 and 50/30/20. Neither the two opposing shares nor the unchanged share can be recovered from that single number.
A second check: what could zero hide?
Consider two more fictional 100-bank panels. One has 0 tightening, 0 easing and 100 unchanged answers. Another has 40 tightening, 40 easing and 20 unchanged answers. Both differences equal zero. Yet one contains no changing banks and the other contains 80.
Cancellation isn’t the same thing as everyone giving the same answer.
SLOOS net tightening: find every possible complete panel
The two panels are examples, not the only ways to obtain the headline. Keep the fictional denominator at 100 and require every bank to answer once. Let the number easing be e. A net difference of 20 then requires e + 20 tightening answers.
The unchanged count must fill the remaining places: 100 − e − (e + 20) = 80 − 2e. Each count must be a whole number at least zero. Consequently, e can range from zero through 40 in this invented complete panel.
At one endpoint, 20 banks tighten, none ease and 80 are unchanged. At the other, 60 tighten, 40 ease and none are unchanged. Both produce the same 20-point difference. The tightening count can therefore be anything from 20 through 60 under these assumptions.
This is why the headline alone can’t establish that a majority tightened. The first endpoint has only one fifth tightening; the second has three fifths. A claim about a majority requires the actual tightening share, not just its difference from easing.
The number changing in either direction is 2e + 20. It ranges from 20 to 100. A small unchanged group and a large unchanged group can both be consistent with this particular net result.
Test the reconstruction in both directions
Choose e = 15 for another independent panel. The counts become 35 tightening, 15 easing and 50 unchanged. First check that they sum to 100. Then subtract the opposing shares: 35% − 15% = 20 percentage points.
Now try an impossible proposal: 35 tightening, 15 easing and 60 unchanged. The subtraction still gives 20, but the total is 110. It fails the complete-panel assumption before any interpretation begins.
A second impossible proposal is 65 tightening and 45 easing among 100 complete answers. The net difference is again 20, yet those two categories already total 110. A correct subtraction can’t rescue incompatible source counts.
Use both checks when reviewing a chart someone else prepared. The categories must reconcile to the stated denominator, and the subtraction must reproduce the headline. Passing only one check leaves a potentially misleading display.
SLOOS net tightening doesn’t reveal intensity
Take Panel A’s 30 tightening answers. In a further invented breakdown, 25 could report some tightening and five more substantial tightening. Reverse those two counts and the pooled tightening total remains 30.
If the ten easing answers and 60 unchanged answers stay fixed, both versions retain the same 20-point net difference. The pooled result can’t tell you which intensity breakdown occurred.
These invented subdivisions teach information loss; they aren’t reconstructed Federal Reserve responses. For a real release, read its exact response labels and table rather than treating informal descriptions in a teaching example as official categories.
The same limitation applies when a summary combines opposing answers. A net number is useful for its defined purpose, but recovering the ingredients requires additional information. Don’t describe a guessed breakdown as though it came from the published survey.
Keep shares and respondent counts distinct
Consider a separate complete panel of 50 equally counted banks. Suppose 15 tighten, five ease and 30 are unchanged. The shares are 30%, 10% and 60%, producing a 20-point net difference.
That result matches Panel A even though every count is half as large. Reporting only the number 20 loses both the opposing shares and the denominator. Always retain the respondent count when it’s part of the supplied evidence.
Equal bank counts in these exercises don’t represent dollars lent. A bank with a large loan book still contributes one answer here. You can’t translate 30 of 100 tightening answers into 30% of loan dollars without separate, appropriate volume information.
Nor does the panel measure how many individual applications were approved. The unit is a bank response to a specified question. Keep that unit visible before connecting the result to a household or business borrowing decision.
Explore missing answers without filling them in
For a new hypothetical exercise, assume 100 banks were invited and only 90 answered. The known responses are 30 tightening, ten easing and 50 unchanged. Among respondents, the difference is (30 − 10) ÷ 90 × 100 = about 22.22 percentage points.
Don’t silently add the ten missing banks to the unchanged category. Missing information isn’t a response of “unchanged.” Doing that would replace the known 90-answer denominator with an unsupported complete panel.
Instead, ask what the full 100-bank difference could be if the missing answers became known. If all ten eased, the difference would be 30 − 20 = ten points. If all ten tightened, it would be 40 − 10 = 30 points.
The resulting ten-to-30 range is a logical bound for this invented missing-answer exercise. It isn’t a confidence interval, a probability statement or a description of the Federal Reserve’s handling of nonresponse.
Write a caption that survives a second reader
A useful caption identifies the fictional panel, question, period, denominator and two opposing shares. It then states the difference in percentage points. If any of those inputs is missing, say which one can’t be recovered from the headline.
For the 50-bank example, a precise sentence would identify 15 tightening and five easing answers out of 50, then report their 20-point difference. Avoid wording that makes the net look like a count of banks or the share of approved loans.
When comparing two releases, first verify that their products, questions and respondent groups are comparable. A numerically identical result from a different question doesn’t become the same measurement merely because the subtraction looks familiar.
The practical SLOOS net tightening check is to reconstruct what the evidence supports and leave the rest open. A complete response table can answer questions that one summary number can’t. Keep both available when explaining the finding.
For the missing-answer exercise, the respondent calculation and the full-panel bounds use different denominators. Label both explicitly. Reporting 22.22 beside the ten-to-30 range without that explanation would conceal why the numbers answer different questions.
Reconstruct SLOOS net tightening before interpreting it
Check the exact question, product, respondent group, period, direction shares and denominator before calculating a net.
Put two boxes underneath: “Known from the supplied answers” and “Still missing.” For Panel A, the first box can contain all three response shares and the 20-point difference. If you receive only the headline, the individual shares belong in the second box.
Keep the conclusion as narrow as the exercise
Stronger demand alongside tighter standards is possible: these answer different questions.
A precise summary of Panel A is: “In this fictional panel, 30 of 100 banks tightened, 10 eased and 60 were unchanged; the tightening share exceeded the easing share by 20 percentage points.”
A net balance alone provides no individual loan-decision data or personal approval probability.
For other survey and lending-data comparisons, review HMDA mortgage-rate loan mixes and Small Business Credit Survey financing percentages. Keep the sample, question and denominator visible in each analysis.
Deferred Compensation
A deferred-compensation statement and payroll form can describe different rights and events.
Loan Horizons
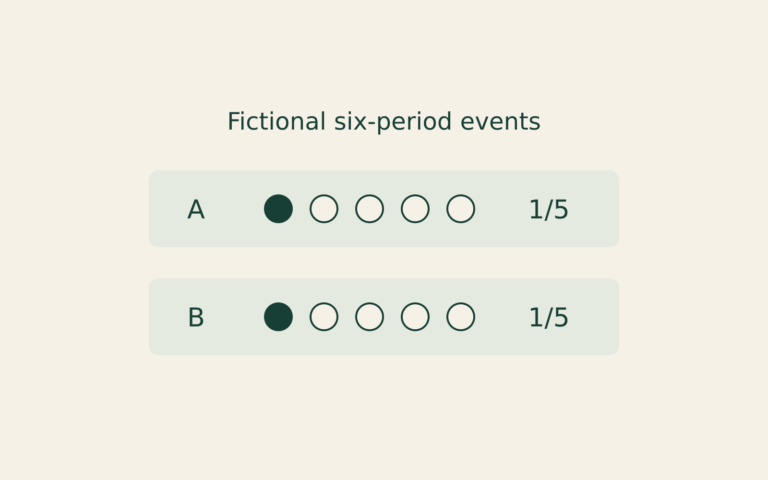
A smaller cumulative missed-payment count can reflect a shorter observation window. This fictional record exercise compares equal payment ages instead.
Rate Transmission
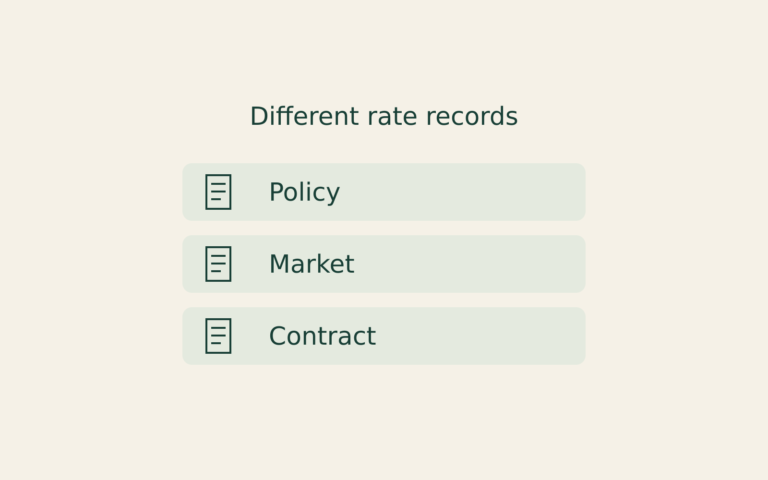
A rate announcement, a market yield and a contract reset describe different links between monetary policy and borrowing costs.