Read G.19: Credit Outstanding, Monthly Flows and Annual Rates
Use a fictional balance bridge to separate outstanding credit from advances, convert monthly flows into annual rates, and handle a technical break.

Estimated reading time: 8 minutes
Consumer credit data in G.19 needs a unit check before a growth comparison. Separate the amount outstanding from monthly changes and annualized rates.
A credit balance measures an amount outstanding, not everything advanced during a month. G.19 covers consumer borrowing for personal purposes and excludes loans secured by real estate. It isn’t a measure of all household debt. Federal Reserve coverage notes
Consumer credit data: build the balance bridge first
Every number below is fictional, in billions of dollars, for one invented month. This simplified exercise leaves out valuation effects, fees, interest additions and technical breaks unless expressly introduced. Advances are stipulated additions to balances; reductions combine repayments and other stipulated net reductions. This isn’t the Federal Reserve’s full estimation process.
| Step | Amount |
|---|---|
| Opening balance | 1,000 |
| Advances during the month | +70 |
| Reductions during the month | −60 |
| Closing balance | 1,010 |
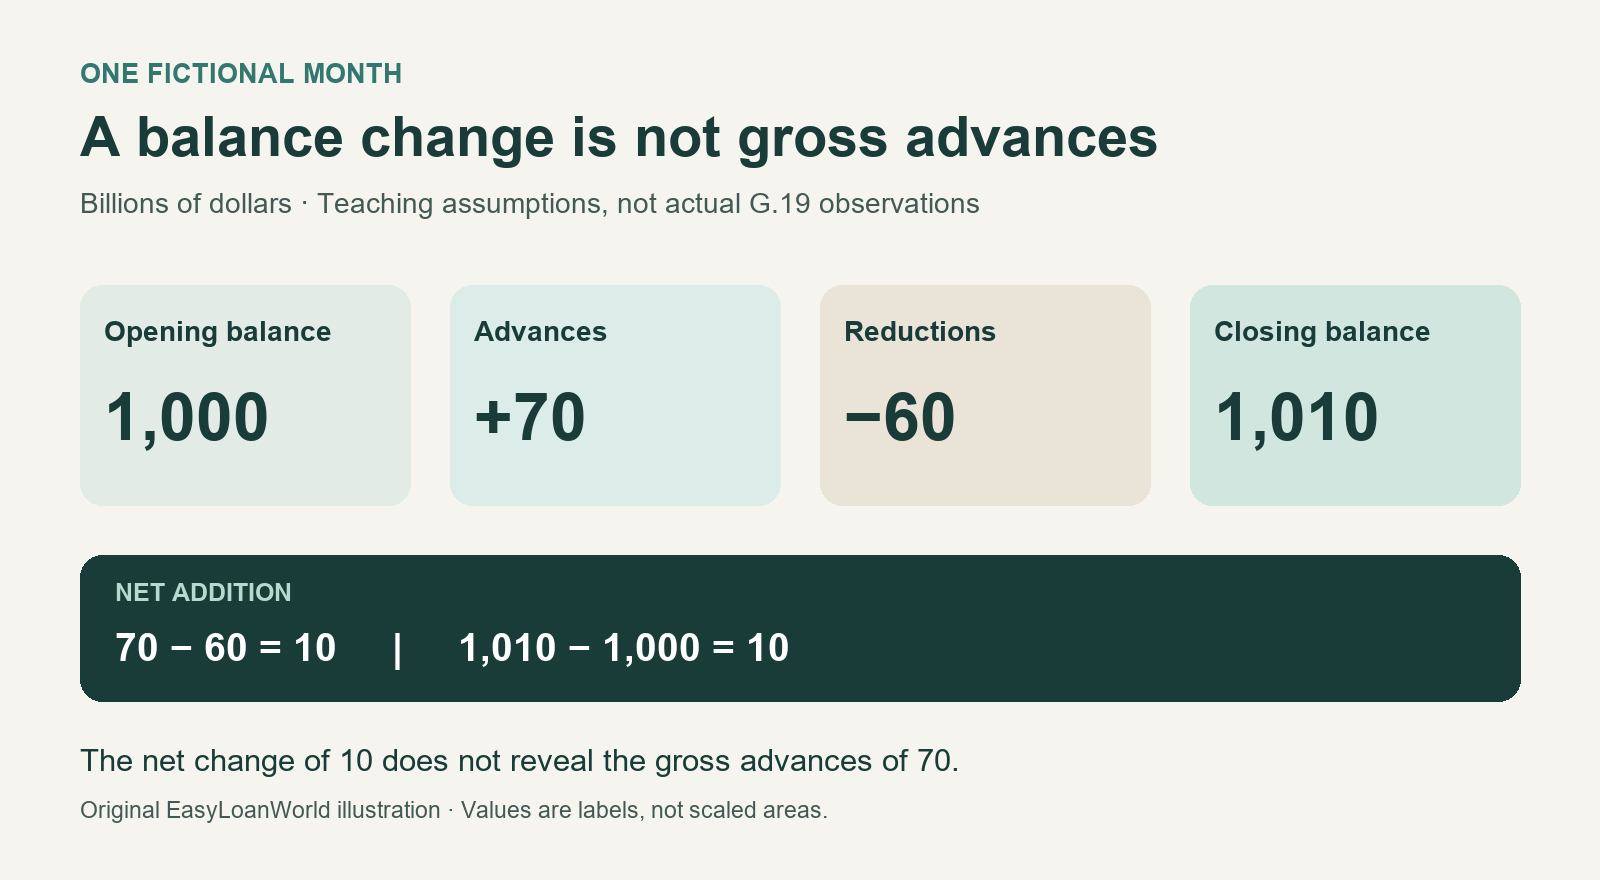
Reconcile the balance: 1,000 + 70 − 60 = 1,010. The net addition is 1,010 − 1,000 = 10.
Here, a $10 billion rise accompanies $70 billion of advances. Advances need not represent newly signed loan contracts: this exercise counts additions to balances, not contracts. Alternatively, 170 of advances and 160 of reductions would produce the same closing balance. The net change alone can’t recover either gross amount.
Convert the time unit, not the closing balance
The Federal Reserve calculation explanation describes simple annualization of monthly flows. Applying that method to our fictional inputs:
- Monthly flow: 1,010 − 1,000 = 10 billion dollars.
- Monthly percentage: 10 ÷ 1,000 × 100 = 1%.
- Annual-rate flow: 10 × 12 = 120 billion dollars.
- Annual-rate percentage: 120 ÷ 1,000 × 100 = 12%.
The closing balance is still 1,010. “12% at a simple annual rate” doesn’t mean 12% growth occurred that month. It’s neither compounded growth nor a forecast of the next eleven months.
To reverse this conversion for a monthly column, divide its annual-rate flow by twelve: 120 ÷ 12 = 10. Do not apply that rule indiscriminately to quarterly or annual columns, or annualize a flow twice.
Keep a technical break separate
A separate fictional exercise assumes no seasonal effect: opening balance 1,000, closing balance 990, and a recorded technical break of −20.
- Raw change: 990 − 1,000 = −10.
- Flow excluding the break: 990 − 1,000 − (−20) = +10.
- Reconciliation: 1,000 + 10 − 20 = 990.
The balance falls while the adjusted flow is positive. The break is supplied by the example’s records; never invent an adjustment to force agreement. G.19’s methodology removes breaks from unadjusted changes in levels. Consult its documentation before interpreting a discrepancy.
Date consumer credit data by release and observation month
The G.19 release page inspected on October 20, 2026 was dated October 7, 2026 and reported August 2026 observations. August was preliminary; June and July were revised. This link changes as releases are published.
Its first credit table is seasonally adjusted, with flow and percentage rows expressed at annual rates. Holder flows are unadjusted but still annualized. Percentage calculations use unrounded inputs, simple annualization and break adjustments. Subtracting rounded displayed levels need not reproduce a reported flow.
Consumer credit data: keep the prior balance in the rate
Continue the first fictional bridge with another month adding exactly 10 billion dollars and no break or other excluded change. The second month opens at 1,010 and closes at 1,020. Its dollar flow matches the first month’s 10.
The second monthly percentage is 10 divided by 1,010 times 100, approximately 0.9901%. Simple annualization produces approximately 11.8812%, compared with the first month’s 12%.
The small rate difference comes from the larger prior balance, not a smaller dollar addition. Using 1,000 again for the second month’s denominator would compare the wrong opening amount.
For a separate fictional series with a 2,000 opening balance and the same 10 monthly flow, the monthly percentage is 0.5% and the simple annual rate 6%. Equal dollar flows don’t imply equal percentage rates across different bases.
The difference between 12% and 6% is six percentage points. Relative to 12%, 6% is half as large. Neither statement means the outstanding credit balance fell by 50%; these are rate comparisons with specified denominators.
Consumer credit data: check the period behind annualization
For a separate arithmetic conversion exercise, assume an opening quarterly balance of 3,000 and a supplied net addition of 30 over one quarter. Use simple annualization and no break, seasonal effect or other change solely for this example.
The quarterly percentage is 30 divided by 3,000 times 100, or 1%. Multiplying the quarterly flow by four gives an annual-rate flow of 120, and its simple annual-rate percentage is 4%.
Multiplying that quarterly 30 by twelve would incorrectly treat a quarter’s flow as a month’s flow. It would produce 360 and 12%, three times the intended simple annual conversion for this stipulated quarter.
This doesn’t reproduce an actual G.19 quarterly observation. It demonstrates why the source period must be identified before selecting a conversion. An annual-rate label alone doesn’t tell you whether the underlying observation is monthly or quarterly.
The first fictional monthly 10 and this quarterly 30 both convert to annual-rate dollar flows of 120. Their percentages differ because the denominators are different. Always retain both the dollar unit and the rate’s prior-balance base.
Apply a supplied technical break with its sign
The original separate break exercise has a raw decline of 10 and a negative break of 20, leaving a positive flow of 10 after subtracting the break. A negative adjustment isn’t something to subtract twice.
For another independent case, assume opening balance 1,000, closing balance 1,030 and an expressly recorded positive technical break of 20. Raw change is 30; subtracting the positive break leaves a flow of 10.
The reconciliation is 1,000 plus 10 plus 20 equals 1,030. This case and the original negative-break case have different raw balance movements but the same fictional break-excluded flow.
For a further independent case, opening 1,000, closing 990 and a recorded break of negative 10 produce zero flow: negative 10 minus negative 10 equals zero. The stipulated balance decline is entirely the supplied break in that example.
None permits inventing a break to obtain a desired growth rate. Use only the adjustment documented by the source. In real G.19 work, seasonal treatment, unrounded inputs and methodology also matter, as described above.
Keep source vintages together when checking a change
Use a new fictional no-break, no-seasonality pair of releases. Version 1 lists July at 1,000 and August at 1,010. Version 2 revises July to 1,005 and August to 1,015.
Each internally consistent version has an August change of 10. Version 2’s simple annual-rate percentage is 120 divided by 1,005 times 100, approximately 11.9403%. Version 1’s corresponding rate is 12%.
Combining version 2’s August 1,015 with version 1’s July 1,000 would produce a change of 15 and a supposed 18% simple annual rate. That result belongs to neither complete release version.
Keep the release date beside every extracted value. If you compare revisions, identify them as revisions to the same observation, rather than describing them as newly occurring monthly borrowing.
These simplified release versions don’t assert actual revisions or reproduce the Federal Reserve’s full process. Their purpose is to show why mixing dates can create a false change even when each source number was copied accurately.
Write a claim that retains its measurement limits
A useful sentence names the observation month, release vintage, series, level or flow, units, seasonal treatment and annualization. Keep any preliminary marker attached to the figure rather than dropping it from the summary.
For the classroom bridge, distinguish stipulated advances from the net addition. The same ending balance can arise from different gross additions and reductions. Neither the net change nor its annualized rate supplies the number of new contracts.
Likewise, these examples contain no default rate, lending approval rate or household affordability estimate. A larger aggregate balance can’t by itself answer those questions. They require different measures and evidence.
Preserve the exact source table or saved release with your extraction. That allows a later reader to reproduce the arithmetic and distinguish a data revision, unit error or interpretation error without guessing.
A consumer credit data check should preserve the sign and unit at every step. A negative flow, negative technical break and positive level are different concepts. Removing minus signs for a presentation can reverse the meaning of the bridge. Retain the signed working calculation alongside any prose summary so the statement can be audited against the source.
Save a small extraction record
- Release date, observation month and saved source version.
- Exact series and row; level or flow; dollars or percentage.
- Period covered, annual-rate label and consistent seasonal treatment.
- Preliminary or revised markers; break treatment and rounding limits.
For our first fictional bridge, a supported sentence is: “Outstanding credit closes the month at $1,010 billion after a $10 billion net addition; stipulated advances were $70 billion.” That calculation supplies no delinquency rate, approval probability or reason for an individual to borrow.
For further practice interpreting financial statistics, compare delinquency rates and new-delinquency measures and SLOOS net tightening responses. Define the measure before calculating or labeling a change.
Deferred Compensation
A deferred-compensation statement and payroll form can describe different rights and events.
Loan Horizons
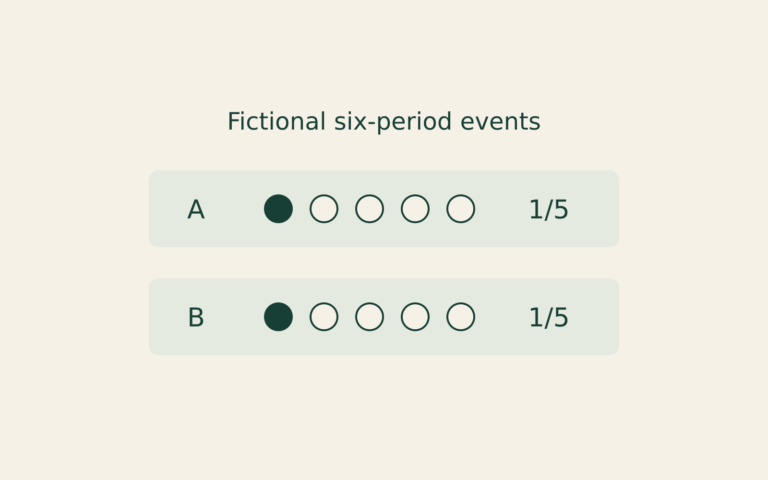
A smaller cumulative missed-payment count can reflect a shorter observation window. This fictional record exercise compares equal payment ages instead.
Rate Transmission
A rate announcement, a market yield and a contract reset describe different links between monetary policy and borrowing costs.