Delinquency Rate or New Delinquencies? Read the Two Denominators
A complete fictional balance ledger explains an 8% delinquency stock and a 2.22% quarterly entry fraction, plus three reasons a snapshot can change.
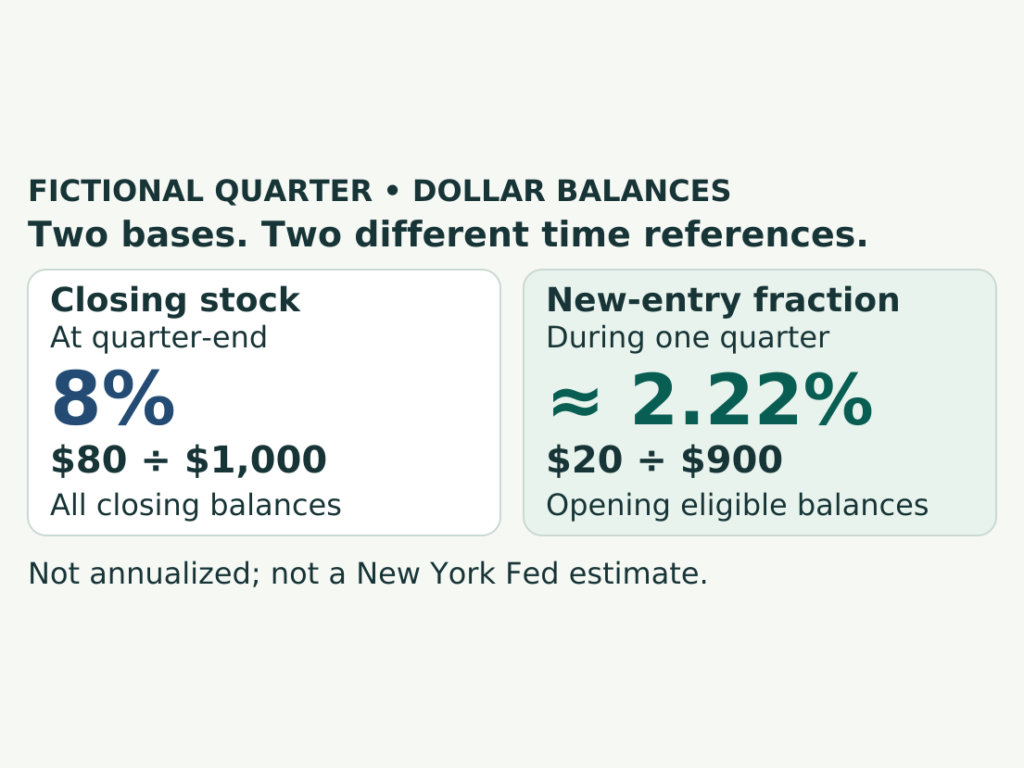
Eight percent of a balance can be seriously delinquent even when just 2.22% of the eligible opening balance newly entered that state during the quarter. An invented ledger shows how both numbers fit.
Start with two questions: how much troubled debt remains at the end of a period, and how much previously eligible debt moved into trouble during it? A snapshot answers the first. A transition calculation answers the second.
A fictional $1,000 portfolio, with every dollar accounted for
This classroom example uses invented dollar balances and two snapshots one quarter apart. “Serious” is a stipulated state for the exercise. No interest, fees, new advances, principal changes or reporting exits occur in the base case. Only the balances’ status changes. A cure means a return to current status, not a principal repayment in this fixed-balance abstraction.
| Balance status | Opening snapshot | Changes during quarter | Closing snapshot |
|---|---|---|---|
| Seriously delinquent | $100 | +$20 entrants − $40 cures | $80 |
| Current or less than 90 days late | $900 | −$20 entrants + $40 cures | $920 |
| Total | $1,000 | No net change | $1,000 |
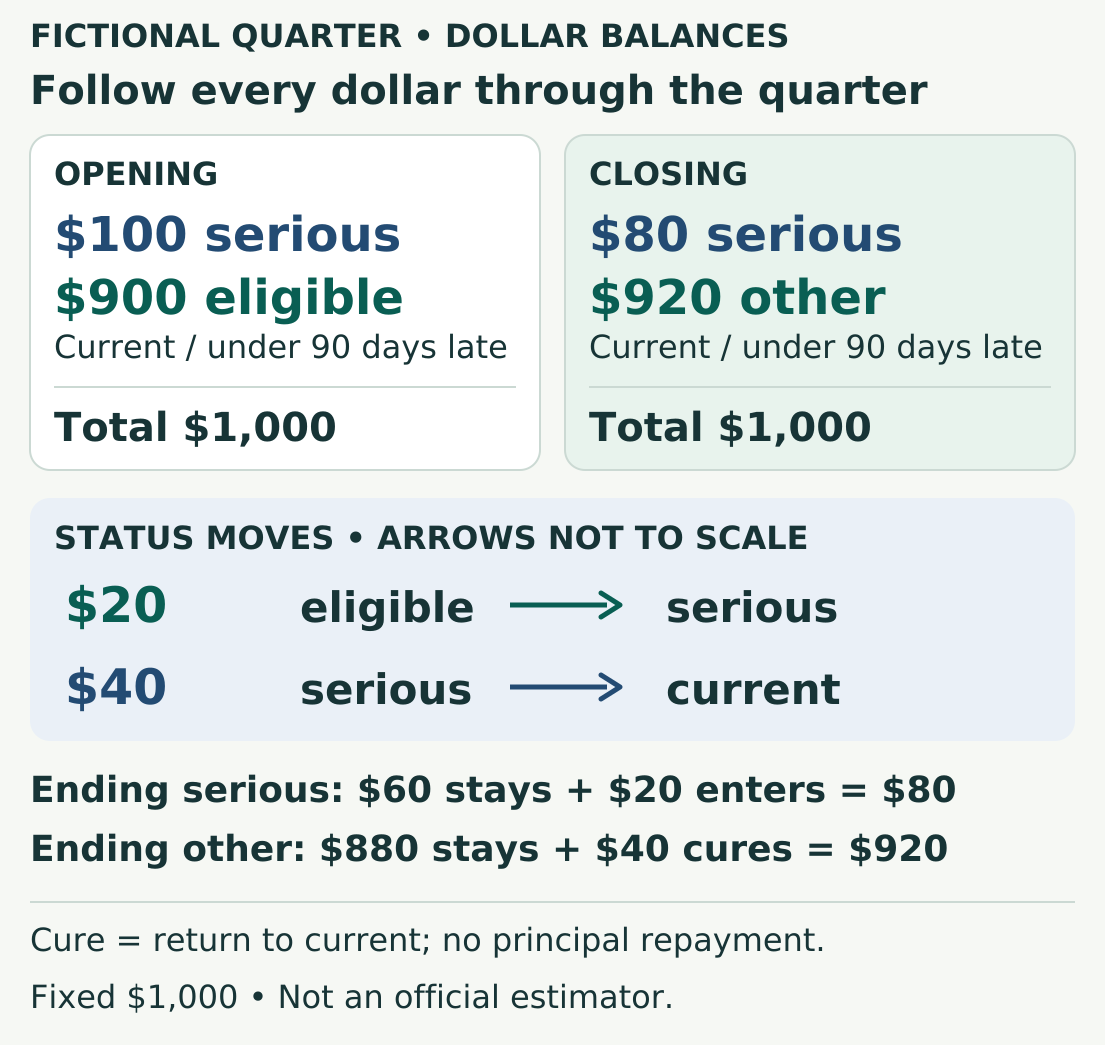
The closing $80 consists of $60 that stayed serious and $20 that newly entered. Adding another $20 to that closing balance would count the entrants twice.
The closing stock share: 8%
Divide the closing serious balance by the whole closing portfolio: $80 ÷ $1,000 = 8%. This includes both retained and newly serious balances. The denominator includes every dollar still in the toy portfolio at that snapshot.
The quarter’s new-entry fraction: 2.22%
Divide the $20 entering serious status by the $900 that started outside it: $20 ÷ $900 ≈ 2.22%. The $100 already serious at opening was not eligible to become newly serious in this exercise.
That is a single-quarter conceptual entry fraction, not an annualized statistic. Neither calculation counts people. An 8% balance share does not mean eight out of every hundred borrowers are delinquent, and 2.22% is not anyone’s personal chance of default.
Three separate changes that move the snapshot
Each branch below changes one feature of the fictional example. They are alternatives, not a sequence to add together.
1. Fewer cures, with the same new entrants
Return to the opening portfolio and let only $20 cure instead of $40. The ending serious balance becomes $100 + $20 − $20 = $100. Its stock share is now 10%, while the quarter’s entry fraction remains $20 ÷ $900 ≈ 2.22%.
The higher closing share, compared with the base case’s 8%, does not require more new entrants. Less balance leaving serious status is sufficient.
2. A smaller total, with no additional delinquency
Instead, take the base case’s closing snapshot: $80 serious out of $1,000. Suppose $200 of performing balances is then paid off and leaves the portfolio. Serious balances remain $80, but the total falls to $800. The stock share becomes $80 ÷ $800 = 10%.
This is a separate post-snapshot denominator change; it does not revise the earlier quarter’s opening eligible base. The percentage rises even though the number of seriously delinquent dollars does not.
3. A reporting exit, with no assumed repayment
Again start from the base closing snapshot. This time stipulate that $20 of serious balances leaves the measured dataset. The serious balance falls to $60 and the measured total to $980: $60 ÷ $980 ≈ 6.12%.
Using $1,000 as the denominator would incorrectly retain dollars removed from measured coverage. This branch describes a measurement change only. It supplies no evidence about whether the underlying obligation was paid, forgiven or otherwise resolved.
Where the official measures need extra care
The New York Fed’s credit-card explanation distinguishes outstanding seriously delinquent balances, divided by all reported balances, from new serious-delinquency transitions relative to the previous quarter’s eligible balances. Its annualized flow measure uses a four-quarter moving sum.
Read the New York Fed’s explanation.
The report includes 90-day late, 120-day late and severely derogatory balances in serious delinquency. Its transition denominator excludes balances already in the relevant delinquency state in the previous quarter. Numerator construction matters: mortgages use an account’s balance when it enters delinquency; other loan categories use the net increase in delinquent balances across a person’s accounts of that type. Our gross-entry ledger does not recreate that estimator.
Read the Q2 2026 report’s definitions, printed page 43.
The toy ledger isolates the denominator lesson. It cannot be used to calculate the published credit-card series from gross entrants, or to match a published annualized figure directly against 2.22%.
A moving sum is a different time window
For an entirely fictional illustration, suppose four successive quarterly transition fractions are 1%, 1.5%, 2% and the unrounded 20/900 fraction expressed as a percentage. Their sum rounds to 6.72%. Multiplying only the latest quarter by four would instead give 8.89%.
The two operations answer different constructions. Neither fictional result is a forecast, a compounded probability or the percentage of unique borrowers who became delinquent over a year. Keep the invented 2.22% single-quarter figure separate from any official four-quarter moving sum.
In their August 2026 credit-card analysis, New York Fed researchers attribute the divergence they study between stock and flow measures to longer retention of older charged-off balances. That is their product- and period-specific interpretation, not a conclusion established by our invented scenarios.
A charged-off balance can remain in the reported data. A reporting exit therefore should not be assumed from a charge-off, nor treated as proof of forgiveness.
Read the Consumer Credit Panel FAQ.
What a headline percentage leaves unresolved
In the base case, the serious stock falls from $100 to $80 even though $20 enters trouble. In the first branch, fewer cures produce a higher closing share without changing entrants. In the second, the denominator alone raises the percentage. In the third, a reporting exit lowers both numerator and denominator.
Those are arithmetic possibilities, not diagnoses of the economy. To distinguish them in a real portfolio, you would need evidence about movements between states and changes in measured balances. A closing percentage alone cannot identify those movements or establish their causes.
When saving a figure for later comparison, write down its product, balance unit, delinquency threshold, observation period, denominator and time aggregation beside it. Then ask one concrete question: “Am I comparing the amount still in trouble with the amount newly entering trouble?” If so, interpret each measure on its own terms before explaining any gap.
As checked October 21, 2026, the latest listed report covers Q2 2026.
All portfolio amounts, transitions and branch calculations above are original hypothetical examples. They are not observations from the New York Fed’s data.

Invoice vs. Bank Payments: Find a $1,000 Double Count
Follow a fictional refrigerator invoice through six bank payments. A complete register and a two-month checkpoint reveal exactly how an incorrect $14,200 total duplicates…
Home-Sales Headlines: Read the Signing and Closing Calendars
Follow 210 fictional home contracts across signing and closing months, then check which event and comparison base a housing headline actually uses.

SCF Debt Figures: Check Who Is in the Median Before Comparing Yourself
Use a fictional ten-family exercise to see why debt-holder medians and all-family averages answer different questions, then learn how to read an SCF table.