Home-Sales Headlines: Read the Signing and Closing Calendars
Follow 210 fictional home contracts across signing and closing months, then check which event and comparison base a housing headline actually uses.
Estimated reading time: 8 minutes
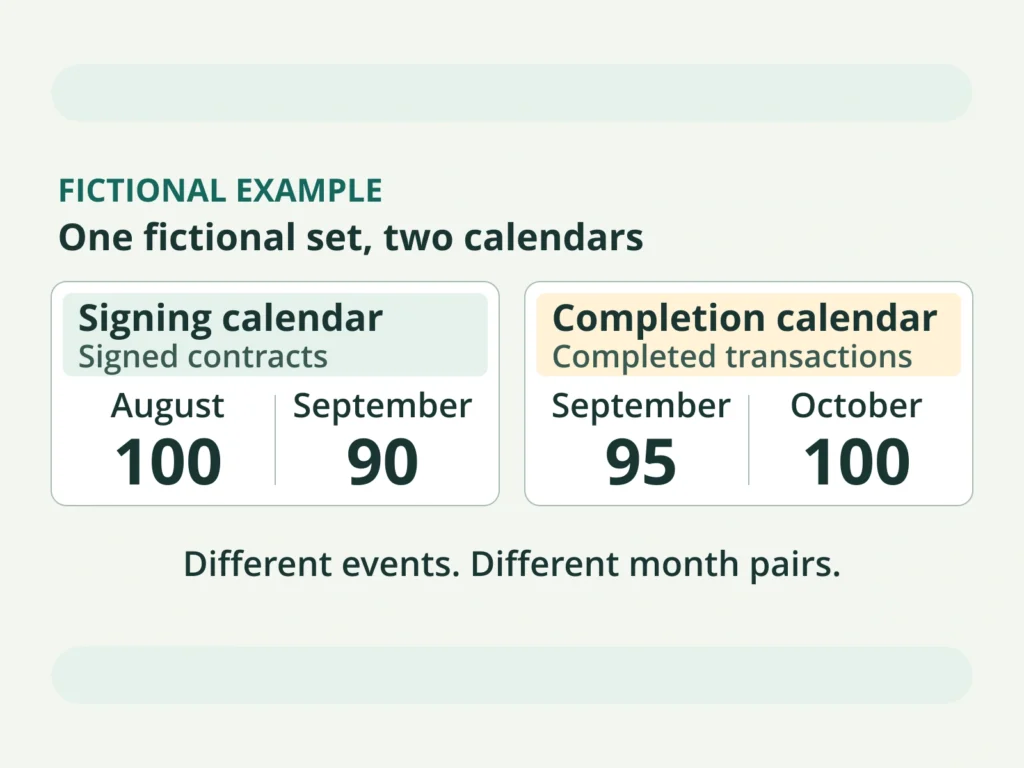
Home sales data can show fewer contracts signed in one month alongside more transactions closing in a later month. Before comparing home-sales headlines, check both the event being measured and the two months used in each percentage change. The fictional calendar below shows why a −10% signing comparison and a +5.26% closing comparison can both be correct.
On October 20, 2026, the National Association of Realtors reported that U.S. pending home sales in September 2026 fell 7.3% from August 2026 and 11.3% from September 2025. Its index tracks signed-contract activity on existing homes before closing. Read the primary release.
Keep the event beside the month when you save a housing headline. A useful note says what was measured, when it happened and which earlier period supplies the comparison. Those labels let you ask a more precise question than whether two percentages seem to agree.
The original exercise below follows one invented set of contracts through two calendars. It demonstrates an arithmetic possibility only. It isn’t observed housing data, a forecast, a cancellation adjustment, a seasonal adjustment or a reconstruction of NAR’s estimator.
Home sales data: identify the event being counted
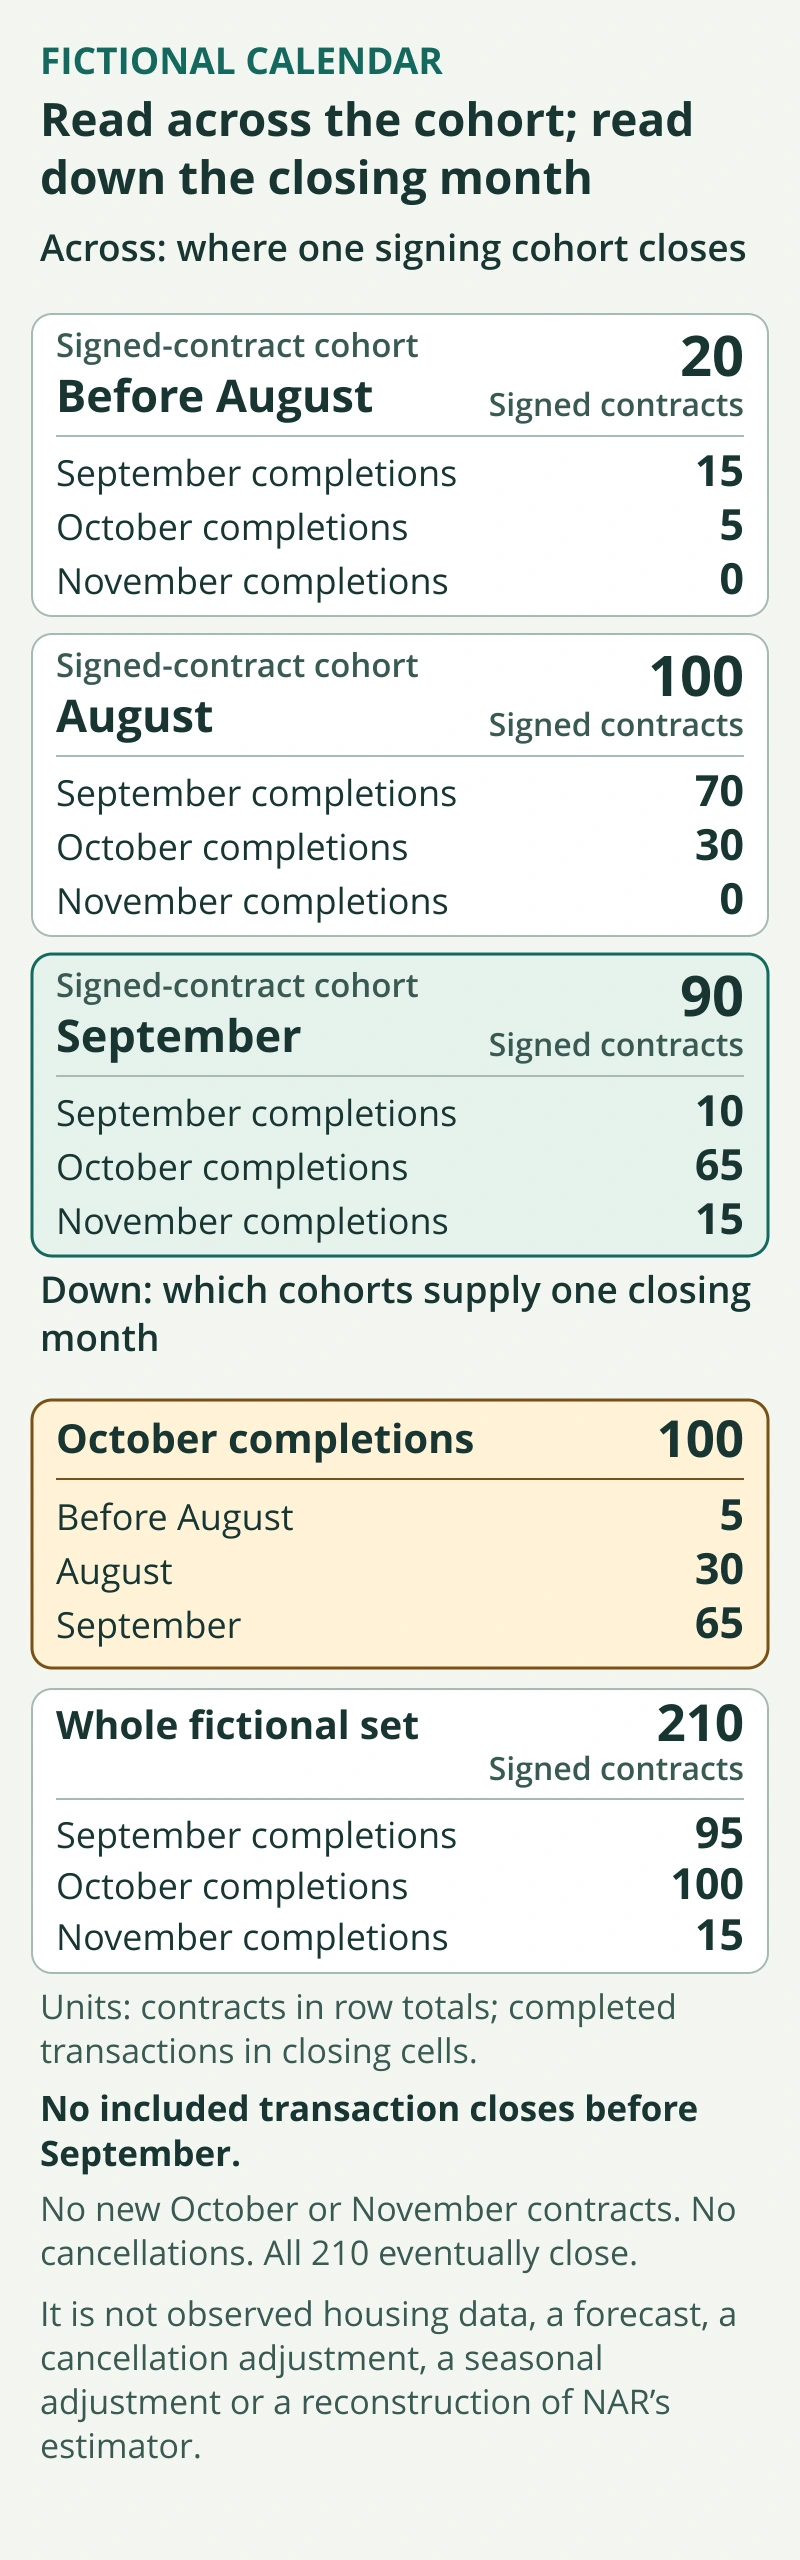
We group contracts by when they were signed. Each group is a signed-contract cohort. The rows follow those groups forward; the columns collect completed transactions by closing month.
| If you read… | You are asking… | Keep this distinction |
|---|---|---|
| Across a signing row | When did this group’s contracts close? | The same signing cohort can close in several months. |
| Down a closing column | Which signing groups supplied this month’s completions? | One closing month can contain several cohorts. |
| A percentage change | How does this value compare with its stated earlier value? | The denominator and comparison months belong to that calculation. |
Assumptions for every number in this exercise:
- At the start of August, 20 contracts signed earlier are still open.
- Another 100 contracts are signed in August and 90 in September.
- None of these contracts closes before September.
- No new October or November contracts enter this fixed exercise.
- No cancellations occur, and all 210 contracts eventually close, once each.
- All counts and timing allocations are invented. There’s no seasonality, price information, probability estimate or market calibration.
An earlier signing doesn’t require an earlier closing in our chosen allocation. The table specifies each group’s timing rather than assuming a common waiting period.
| Signed-contract cohort | Signed contracts | September completions | October completions | November completions |
|---|---|---|---|---|
| Before August | 20 | 15 | 5 | 0 |
| August | 100 | 70 | 30 | 0 |
| September | 90 | 10 | 65 | 15 |
| Whole fictional set | 210 | 95 | 100 | 15 |
Home sales data: read cohorts and closing months
Start with the September signing row. Its 90 contracts finish in three groups: 10 in September, 65 in October and 15 in November. Adding across gives 10 + 65 + 15 = 90. The row tells you what happens to that particular signing cohort.
Now read down October’s completion column. Its 100 transactions come from 5 contracts signed before August, 30 signed in August and 65 signed in September. Adding down gives 5 + 30 + 65 = 100. The column answers a different question: which cohorts contribute to one completion month?
The September cohort’s 90 and October’s 100 therefore describe different selections from the same fictional set. Treating all 100 October completions as September signings would assign 35 transactions to the wrong cohort and overlook the 25 September signings that close in another month.
Calculate two changes with their own starting months
Signing comparison, September versus August: (90 − 100) ÷ 100 × 100 = −10%. The denominator is August’s 100 signed contracts.
Closing comparison, October versus September: (100 − 95) ÷ 95 × 100 ≈ +5.26%. The denominator is September’s 95 completed transactions.
Both results belong only to this invented exercise. The first comparison moves between two signing cohorts. The second moves between two closing columns. It also uses a later pair of months. Keep both differences visible when explaining why the signs differ.
You can trace the five additional October completions without guessing. The two earlier cohorts contribute 35 in October, versus 85 in September, a decrease of 50. The September cohort contributes 65 in October, versus 10 in September, an increase of 55. Together, −50 + 55 = 5.
Nothing in that calculation identifies why a real transaction takes longer or predicts the next market reading. Our allocations were stipulated at the start. A different allocation could produce a different completion pattern with the same signing totals.
Try the missing-cell test
Cover the three completion columns and leave only the signed-contract totals visible. Can you recover October’s total from 20, 100 and 90 alone? You can’t: those totals don’t tell you how the completions are distributed across months.
Now uncover just the October column. You can calculate its 100 completions, but you still can’t calculate the October-versus-September percentage change without September’s column total. One missing comparison base is enough to leave that calculation unresolved.
As a final check, add every completion once: 95 + 100 + 15 = 210. This matches the three signing cohorts’ combined total. It validates the example’s bookkeeping under its assumptions; it supplies no evidence that those assumptions describe a real market.
Home sales data: move ten completions without changing signings
Try a controlled alternative to the original calendar. Keep all signing cohorts and the total of 210 contracts, but move ten of the September cohort’s October completions to November. No cancellation occurs. That cohort now closes 10 in September, 55 in October and 25 in November, still totaling 90.
September completions remain 95. October completions fall from 100 to 90, and November completions rise from 15 to 25. The new October-versus-September closing comparison is (90 − 95) ÷ 95 × 100, or approximately minus 5.26%. The signing comparison remains minus 10%, because neither signing total changed.
Both calendars satisfy the same stipulated signing counts. In one, October completions rise from September; in the other, they fall. The difference comes entirely from the assigned closing dates. This is a demonstration of what additional timing information is needed, not an estimate of how many real contracts will be delayed.
Check the revised universe: 95 + 90 + 25 still equals 210. A completion moved from one column to another must be removed from the first before being added to the second. Counting the ten in both months would create 220 apparent completions from a fixed set of 210 contracts.
Home sales data: distinguish a remaining stock from a monthly flow
Return to the original calendar for a separate check. After September’s 95 completions, 115 of the 210 included contracts remain open. After October’s 100 additional completions, only 15 remain open. After November, none remains in this fixed exercise.
The 115 and 15 are balances still awaiting completion at stated checkpoints. They aren’t another set of newly signed contracts or extra monthly closings. Adding September’s remaining 115 to October’s 100 completions would combine an earlier stock with a later flow and count many of the same transactions again.
For a real headline, record whether the reported quantity is a count, an index level, a rate or a change. This toy calendar uses actual invented counts throughout. Its 210-contract conservation check can’t be applied unchanged to an index with a different construction or a changing measured universe.
Keep an explicit boundary note when using the exercise: no new October or November contracts enter, and no cancellation removes a contract. Those restrictions make the arithmetic inspectable. They aren’t assumptions to impose on real housing data when the source uses different coverage.
Match your next question to the evidence it needs
A calendar comparison contains no property price, loan offer, household budget or individual closing probability. Adding a transaction conclusion would require information that this exercise never supplied. Use the question you actually need answered to choose the next record:
- “What does this proposed seller offer change?” Use the actual offer and financing terms with the seller-credit and price-reduction comparison.
- “What happens if my closing date moves?” Start with your written terms and the rate-lock deadline guide.
- “Does this property fit my finances?” Use property-specific costs and your own figures with the homebuying-budget worksheet.
Keep unanswered questions open. An aggregate direction doesn’t supply the missing details for your purchase.
A five-line note for your next housing headline
- Event: What has actually happened: signing, completion or another specified event?
- Coverage: Which homes and which geography are included?
- Observation period: When did the measured activity occur? Record the publication date separately.
- Comparison: Which earlier period and starting value produce the reported change?
- Open question: What do you still need to know, and which evidence could answer it?
For the fictional closing comparison here, the note reads: completions; this fixed 210-contract universe; October; September’s 95 completions as the base; reasons for the allocation unspecified. That’s enough to reproduce the arithmetic while leaving its limits intact.
U.S. educational explainer. All calendar counts and example percentage changes are original hypothetical values, separate from the attributed news paragraph.
Related reading
For a related question, read Housing Data: Choose a Caption and Two Rent Estimates: Work Through the Comparison.
Deferred Compensation
A deferred-compensation statement and payroll form can describe different rights and events.
Loan Horizons
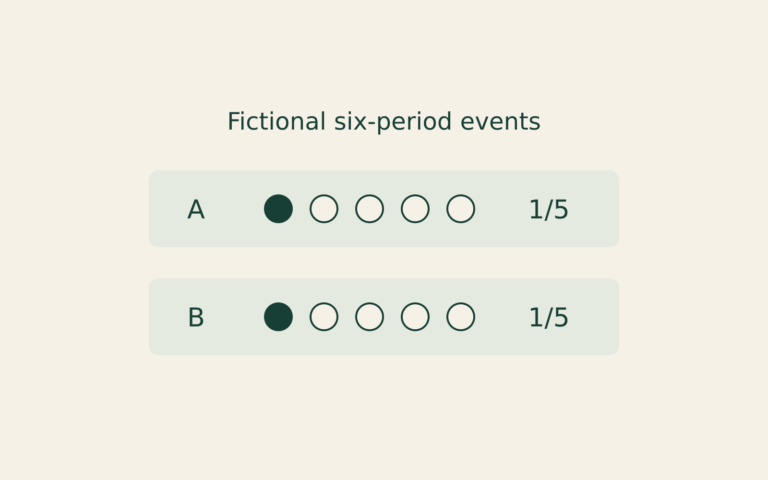
A smaller cumulative missed-payment count can reflect a shorter observation window. This fictional record exercise compares equal payment ages instead.
Rate Transmission
A rate announcement, a market yield and a contract reset describe different links between monetary policy and borrowing costs.