Energy Evidence
Before treating an improvement proposal’s projected energy savings as payment money, identify what its supporting evidence actually measures.
Estimated reading time: 3 minutes
Before treating an improvement proposal’s projected energy savings as payment money, identify what its supporting evidence actually measures.
A modeled home is not an observed household
The Department of Energy’s Home Energy Score methodology describes an estimate based on the home’s envelope, energy systems and floor area. An assessor supplies building information to software that estimates annual energy use using standard operations and local weather patterns. The estimate is then converted to a ten-point score: higher scores indicate lower modeled energy use.
The phrase “standard operations” matters. A report can describe the building under specified assumptions without reproducing how its particular occupants actually use it. When reviewing a proposal, identify whether the cited result is a score for the existing building or an estimate for a proposed configuration. A number without that description leaves the modeled object unclear.
A peer comparison asks a different question
EPA’s Home Energy Yardstick starts with actual energy use from the last twelve months of utility bills. It compares that use with similar homes, using a statistical algorithm that accounts for local weather, home size and occupants. A high score means the home used less energy relative to its peers; it does not identify which individual improvement produced that position.
EPA says the score can change through building or equipment improvements or changes in household operation. It also limits the comparison’s housing scope: apartment data may not produce a valid comparison. Its tool is not a replacement for a professional home energy audit. Read the named benchmark and eligible housing types rather than assuming every energy score is interchangeable.
Weather evidence is not a savings calculation
The National Weather Service’s degree-day explanation describes a temperature-based indicator of heating or cooling demand. Its illustrated method compares the day’s average temperature with a 65°F base. More heating or cooling degree days generally indicate greater demand for energy to condition buildings.
That indicator describes weather, not the efficiency gain from a particular installation. The explanation does not provide a household-specific rule for converting degree days into saved energy. Merely attaching a weather total to a proposal does not supply that missing calculation.
Measured evaluation can challenge a projection
A July 2015 NBER working-paper abstract reports an experimental evaluation of the Weatherization Assistance Program involving more than 30,000 households. The researchers found that model-projected energy savings exceeded the savings they measured. This is historical evidence from a specified program and sample, not a current forecast for another house.
Do not turn that study into a universal percentage discount on an installer’s estimate.
Deferred Compensation
A deferred-compensation statement and payroll form can describe different rights and events.
Loan Horizons
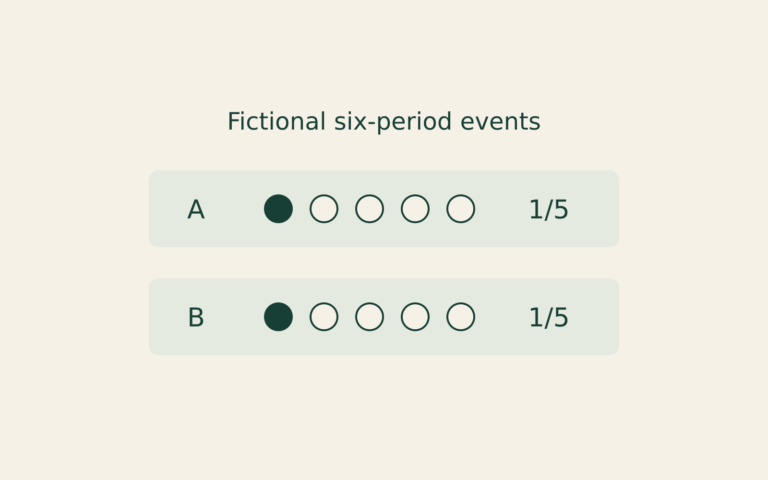
A smaller cumulative missed-payment count can reflect a shorter observation window. This fictional record exercise compares equal payment ages instead.
Rate Transmission
A rate announcement, a market yield and a contract reset describe different links between monetary policy and borrowing costs.