One Free Rent Month: Check the Renewal Base
A fictional free-month credit lowers first-year average rent to $1,925, but the supplied renewal calculation starts from $2,100. Compare both 24-month schedules.
Estimated reading time: 4 minutes
A free rent month can make a first-year average look lower than the amount used in a later calculation. In this fictional comparison, Rental A averages $1,925 a month in its first year, but its supplied renewal calculation starts from $2,100. Substituting the average changes which rental appears less costly over 24 months.
All amounts and terms below are invented. Both alternatives start on the same date and continue for all 24 months. Assume comparable housing use and identical non-rent costs, which are excluded. We compare scheduled rent cash only, without financing, investment earnings or discounting.
Start with the supplied payment schedules
- Rental A: a $2,100 monthly base in the first year. A single $2,100 credit fully offsets month 1; months 2–12 each require $2,100. The credit is applied once and isn’t repaid later.
- Rental B: $2,000 each month for months 1–12, with no credit.
- Months 13–24: the model specifies a 5% increase applied to each original monthly base, with no further credit. A becomes $2,100 × 1.05 = $2,205; B becomes $2,000 × 1.05 = $2,100.
Those second-year amounts and calculation bases are supplied assumptions, not rental forecasts, available offers or findings about renewal rights. The zero payment in A’s first month comes from the stipulated credit, not a missed payment.
| Months | Number of months | A: cash per month | B: cash per month |
|---|---|---|---|
| 1 | 1 | $0 | $2,000 |
| 2–12 | 11 | $2,100 | $2,000 |
| 13–24 | 12 | $2,205 | $2,100 |
The first-year average is a separate number
A’s first-year rent cash is $0 + (11 × $2,100) = $23,100. Divide by all 12 months to get $1,925 per month on average. None of A’s scheduled payments is $1,925: one is zero and the other eleven are $2,100.
B pays 12 × $2,000 = $24,000 in year one. Its average and each monthly payment are both $2,000. A’s first-year rent cash is therefore $900 lower, even though A requires more cash in each of months 2–12.
What goes wrong when the average replaces the renewal base?
Multiplying A’s average by 1.05 gives $1,925 × 1.05 = $2,021.25. That isn’t the supplied second-year payment. The model applies the increase to $2,100, producing $2,205.
The wrong-base calculation understates each second-year payment by $2,205 − $2,021.25 = $183.75. Across 12 payments, the understatement is 12 × $183.75 = $2,205.
The last amount is a full-year error. It happens to equal one correct monthly payment in this one-free-month example, but the two quantities have different roles. The error isn’t an extra charge to add to the correct schedule.
Compare the first year and the full 24 months
| Period | Rental A | Rental B | A minus B |
|---|---|---|---|
| Months 1–12 | $23,100 | $24,000 | −$900 |
| Months 13–24 | $26,460 | $25,200 | +$1,260 |
| All 24 months | $49,560 | $49,200 | +$360 |
A’s $900 first-year advantage is smaller than its $1,260 second-year extra rent. Over the complete schedule, A costs $360 more.
Using the wrong $2,021.25 payment would instead give A a second-year total of $24,255 and a 24-month total of $47,355. That would incorrectly make A appear $1,845 cheaper than B. The $2,205 understatement explains the entire change from an apparent $1,845 saving to the correct $360 extra cost.
Keep the percentage base and the checkpoint clear
A’s base increases from $2,100 to $2,205 by exactly 5%. Comparing $2,205 with its earlier $1,925 monthly average gives ($2,205 − $1,925) ÷ $1,925 = 8/55, or approximately 14.55%. These percentages use different starting amounts; neither measures an actual rental market.
After the first 12 months and another k complete monthly payments, A’s cumulative extra rent is −$900 + $105k, for whole-number k from 0 through 12. After eight additional payments A has paid $60 less; after nine it has paid $45 more. These are payment checkpoints, not early-termination costs or permission to prorate or leave. Both modeled schedules continue through month 24.
Keep three entries separate in a comparison worksheet: the actual payment schedule, the average over a named period, and the stated base for any future calculation. This example doesn’t determine affordability or which real rental to choose.
For different housing questions, see renting versus buying before a planned move and what two survey rent estimates can show.
Illustrative stock photo: Faisal Ahammad / WordPress Photo Directory (CC0).
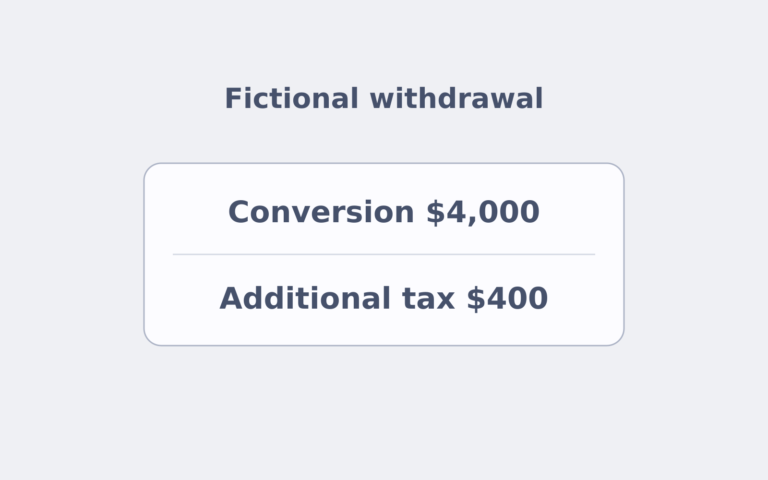
Roth Conversion and Account Clocks
Separate five-year tests.
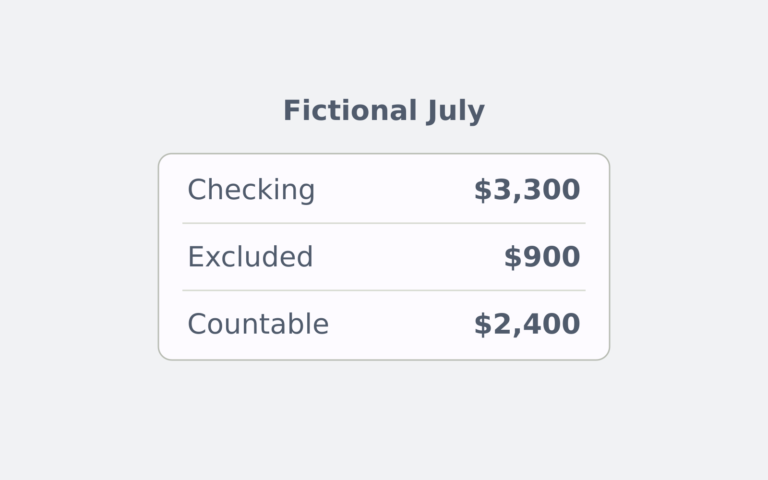
ABLE Distributions Across Month-End
Separate retained purposes.