Recurring Purchases and Average Cost
Count acquired shares.
Estimated reading time: 1 minute
FINRA’s dollar-cost averaging explanation describes equal-dollar purchases at regular intervals. Lower prices buy more shares, so simply averaging the quoted prices does not measure the cost per share acquired.
Count what each payment buys
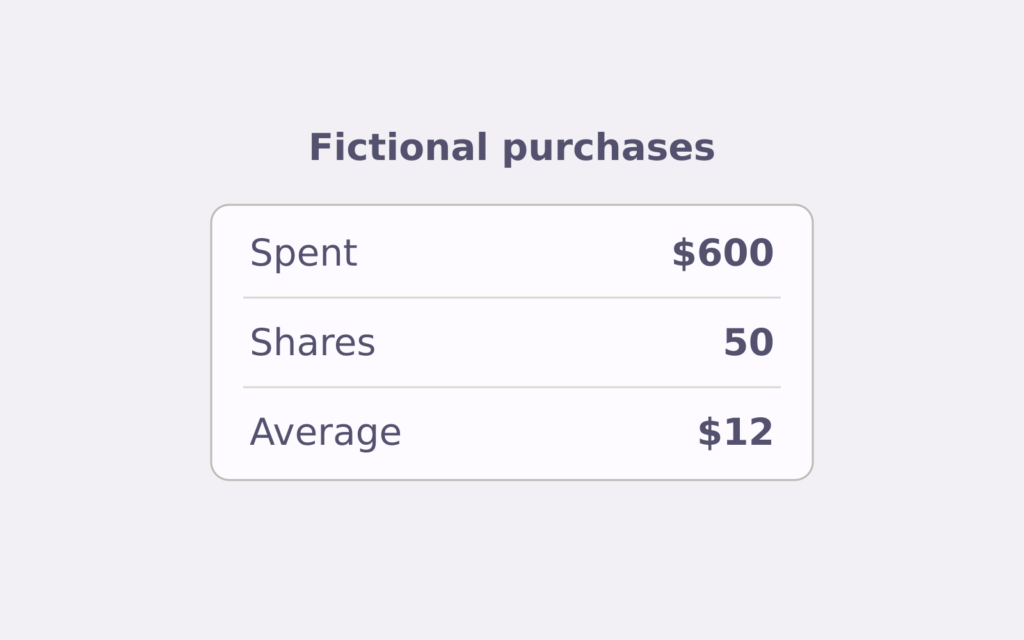
Fictional purchases in consecutive months: $300 at $10 per share buys 30 shares; another $300 at $15 buys 20. Assume complete purchases, no fees, distributions, taxes or other transactions.
Total spending is $600 for 50 shares. Average purchase cost is $600 ÷ 50 = $12 per share, not the $12.50 arithmetic average of the two prices.
A lower average is not a profit
If the later market price is $11, the 50 shares are worth $550—$50 below the $600 spent. Being below the average quoted price did not prevent a loss.
Retain each payment, execution price and quantity. This example establishes neither superiority over investing a lump sum nor future returns. Actual transaction costs matter; the purchase-cost average is not a tax-lot selection method.
Roth Conversion and Account Clocks
Separate five-year tests.
ABLE Distributions Across Month-End
Separate retained purposes.