Home-Sales Headlines: Read the Signing and Closing Calendars
Follow 210 fictional home contracts across signing and closing months, then check which event and comparison base a housing headline actually uses.
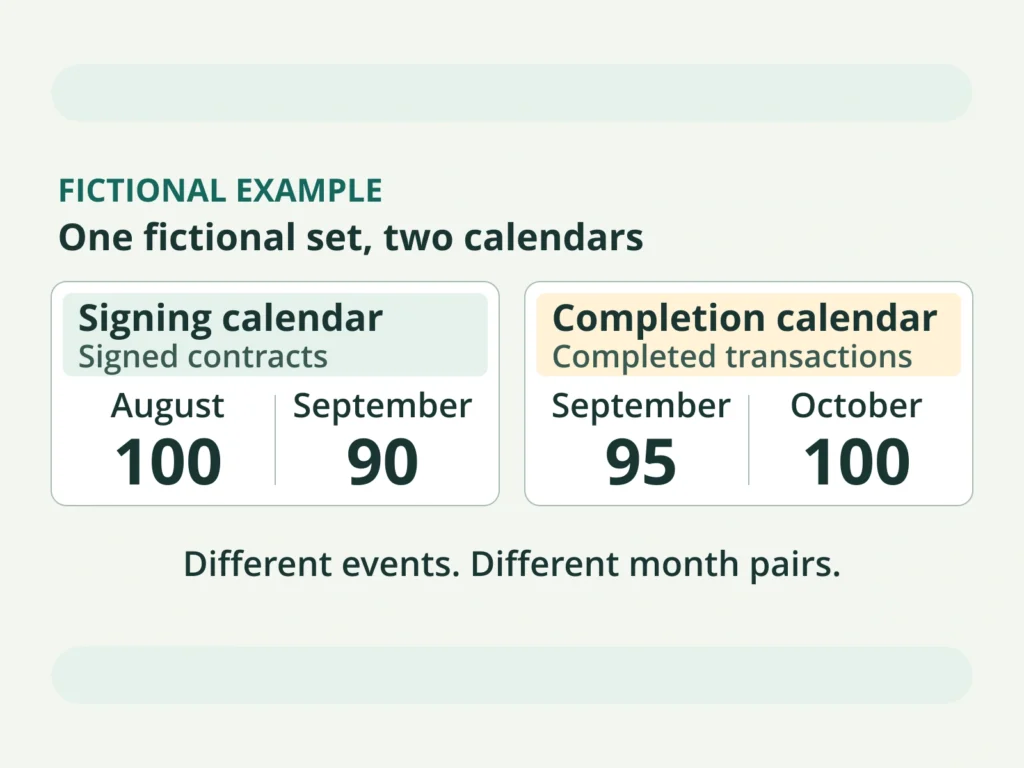
On October 20, 2026, the National Association of Realtors reported that U.S. pending home sales in September 2026 fell 7.3% from August 2026 and 11.3% from September 2025. Its index tracks signed-contract activity on existing homes before closing. Read the primary release.
Keep the event beside the month when you save a housing headline. A useful note says what was measured, when it happened and which earlier period supplies the comparison. Those labels let you ask a more precise question than whether two percentages seem to agree.
The original exercise below follows one invented set of contracts through two calendars. It demonstrates an arithmetic possibility only. It is not observed housing data, a forecast, a cancellation adjustment, a seasonal adjustment or a reconstruction of NAR’s estimator.
Build one complete fictional calendar
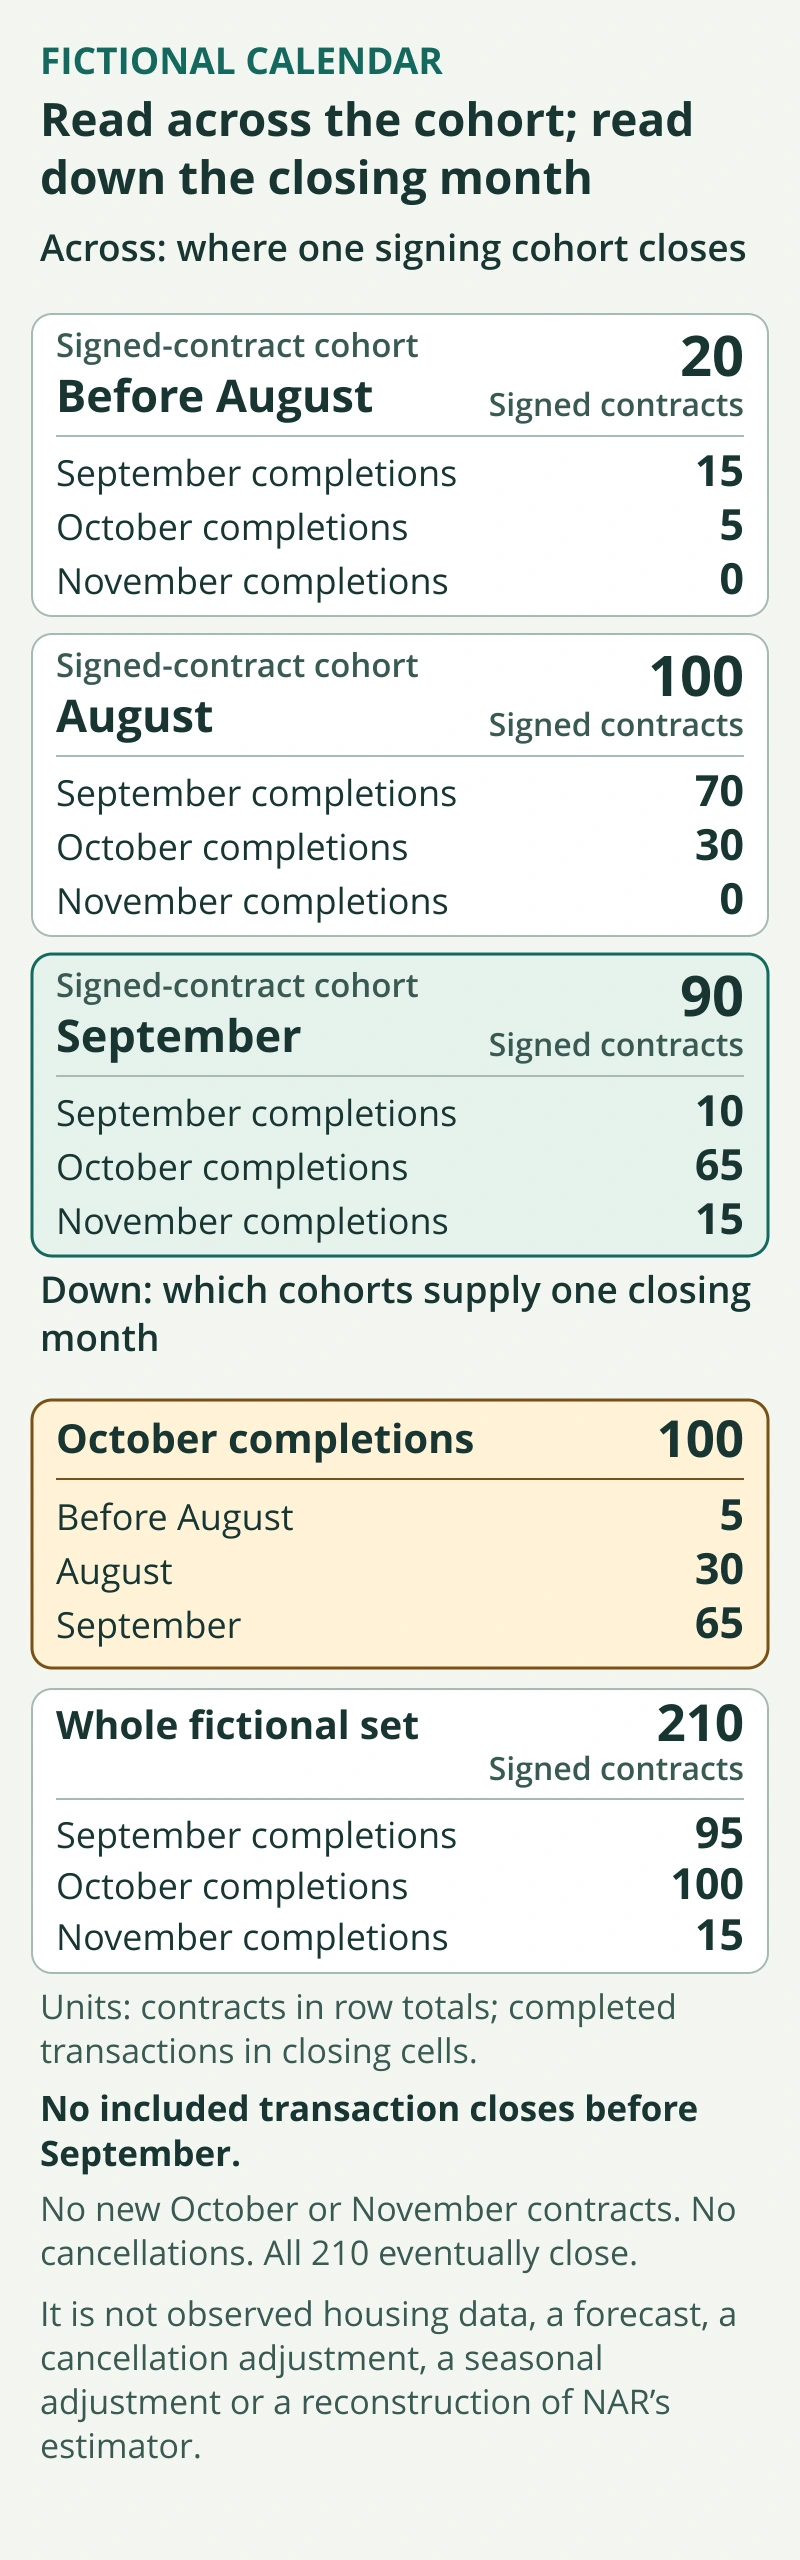
We group contracts by when they were signed. Each group is a signed-contract cohort. The rows follow those groups forward; the columns collect completed transactions by closing month.
Assumptions for every number in this exercise:
- At the start of August, 20 contracts signed earlier are still open.
- Another 100 contracts are signed in August and 90 in September.
- None of these contracts closes before September.
- No new October or November contracts enter this fixed exercise.
- No cancellations occur, and all 210 contracts eventually close, once each.
- All counts and timing allocations are invented. There is no seasonality, price information, probability estimate or market calibration.
An earlier signing does not require an earlier closing in our chosen allocation. The table specifies each group’s timing rather than assuming a common waiting period.
| Signed-contract cohort | Signed contracts | September completions | October completions | November completions |
|---|---|---|---|---|
| Before August | 20 | 15 | 5 | 0 |
| August | 100 | 70 | 30 | 0 |
| September | 90 | 10 | 65 | 15 |
| Whole fictional set | 210 | 95 | 100 | 15 |
Read across a cohort, then down a closing month
Start with the September signing row. Its 90 contracts finish in three groups: 10 in September, 65 in October and 15 in November. Adding across gives 10 + 65 + 15 = 90. The row tells you what happens to that particular signing cohort.
Now read down October’s completion column. Its 100 transactions come from 5 contracts signed before August, 30 signed in August and 65 signed in September. Adding down gives 5 + 30 + 65 = 100. The column answers a different question: which cohorts contribute to one completion month?
The September cohort’s 90 and October’s 100 therefore describe different selections from the same fictional set. Treating all 100 October completions as September signings would assign 35 transactions to the wrong cohort and overlook the 25 September signings that close in another month.
Calculate two changes with their own starting months
Signing comparison, September versus August: (90 − 100) ÷ 100 × 100 = −10%. The denominator is August’s 100 signed contracts.
Closing comparison, October versus September: (100 − 95) ÷ 95 × 100 ≈ +5.26%. The denominator is September’s 95 completed transactions.
Both results belong only to this invented exercise. The first comparison moves between two signing cohorts. The second moves between two closing columns. It also uses a later pair of months. Keep both differences visible when explaining why the signs differ.
You can trace the five additional October completions without guessing. The two earlier cohorts contribute 35 in October, versus 85 in September, a decrease of 50. The September cohort contributes 65 in October, versus 10 in September, an increase of 55. Together, −50 + 55 = 5.
Nothing in that calculation identifies why a real transaction takes longer or predicts the next market reading. Our allocations were stipulated at the start. A different allocation could produce a different completion pattern with the same signing totals.
Try the missing-cell test
Cover the three completion columns and leave only the signed-contract totals visible. Can you recover October’s total from 20, 100 and 90 alone? You cannot: those totals do not tell you how the completions are distributed across months.
Now uncover just the October column. You can calculate its 100 completions, but you still cannot calculate the October-versus-September percentage change without September’s column total. One missing comparison base is enough to leave that calculation unresolved.
As a final check, add every completion once: 95 + 100 + 15 = 210. This matches the three signing cohorts’ combined total. It validates the example’s bookkeeping under its assumptions; it supplies no evidence that those assumptions describe a real market.
Match your next question to the evidence it needs
A calendar comparison contains no property price, loan offer, household budget or individual closing probability. Adding a transaction conclusion would require information that this exercise never supplied. Use the question you actually need answered to choose the next record:
- “What does this proposed seller offer change?” Use the actual offer and financing terms with the seller-credit and price-reduction comparison.
- “What happens if my closing date moves?” Start with your written terms and the rate-lock deadline guide.
- “Does this property fit my finances?” Use property-specific costs and your own figures with the homebuying-budget worksheet.
Keep unanswered questions open. An aggregate direction does not supply the missing details for your purchase.
A five-line note for your next housing headline
- Event: What has actually happened: signing, completion or another specified event?
- Coverage: Which homes and which geography are included?
- Observation period: When did the measured activity occur? Record the publication date separately.
- Comparison: Which earlier period and starting value produce the reported change?
- Open question: What do you still need to know, and which evidence could answer it?
For the fictional closing comparison here, the note reads: completions; this fixed 210-contract universe; October; September’s 95 completions as the base; reasons for the allocation unspecified. That is enough to reproduce the arithmetic while leaving its limits intact.
U.S. educational explainer. All calendar counts and example percentage changes are original hypothetical values, separate from the attributed news paragraph.

Mortgage Quote vs. Freddie Mac’s Average: Five Checks
Work through an invented mortgage quote with five record checks. Track what is known, what is missing and what to ask for in writing.

Invoice vs. Bank Payments: Find a $1,000 Double Count
Follow a fictional refrigerator invoice through six bank payments. A complete register and a two-month checkpoint reveal exactly how an incorrect $14,200 total duplicates…
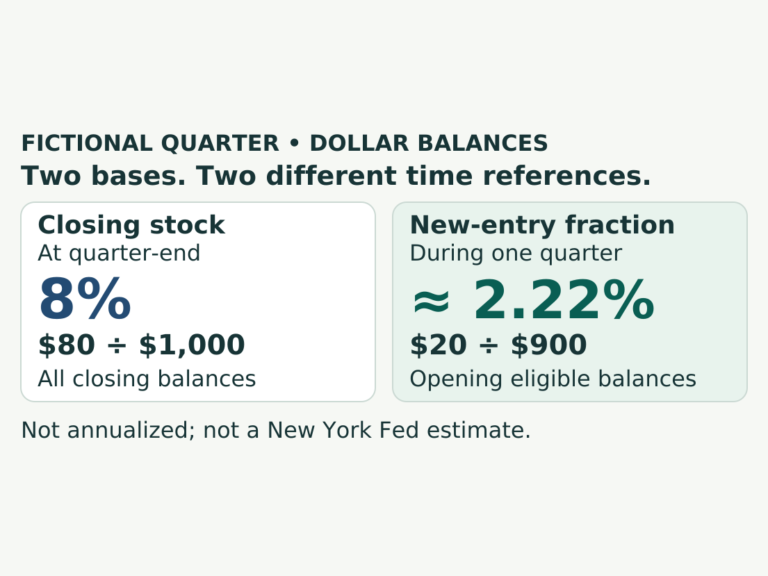
Delinquency Rate or New Delinquencies? Read the Two Denominators
A complete fictional balance ledger explains an 8% delinquency stock and a 2.22% quarterly entry fraction, plus three reasons a snapshot can change.