Equity Returns
A higher profit-to-equity percentage need not mean more profit. This fictional comparison holds operations constant and then reverses the calculation.
Estimated reading time: 4 minutes
A higher profit-to-equity percentage need not mean more profit. This fictional comparison holds operations constant and then reverses the calculation.
Fix the comparison before ranking percentages
Consider three businesses that each begin one period with assets of 100 monetary units. Their beginning debts are 0, 50 and 80, leaving beginning equity of 100, 50 and 20. All debt bears the same assumed 5% interest for this period. Operations produce the same result before that modeled interest. There are no taxes, fees or principal payments in the calculation.
Here, the displayed percentage divides after-interest profit by beginning equity, not average equity or an investor’s purchase outlay. Keep that denominator fixed even for losses. The cases represent alternative financing structures, not consecutive years.
More percentage, less profit
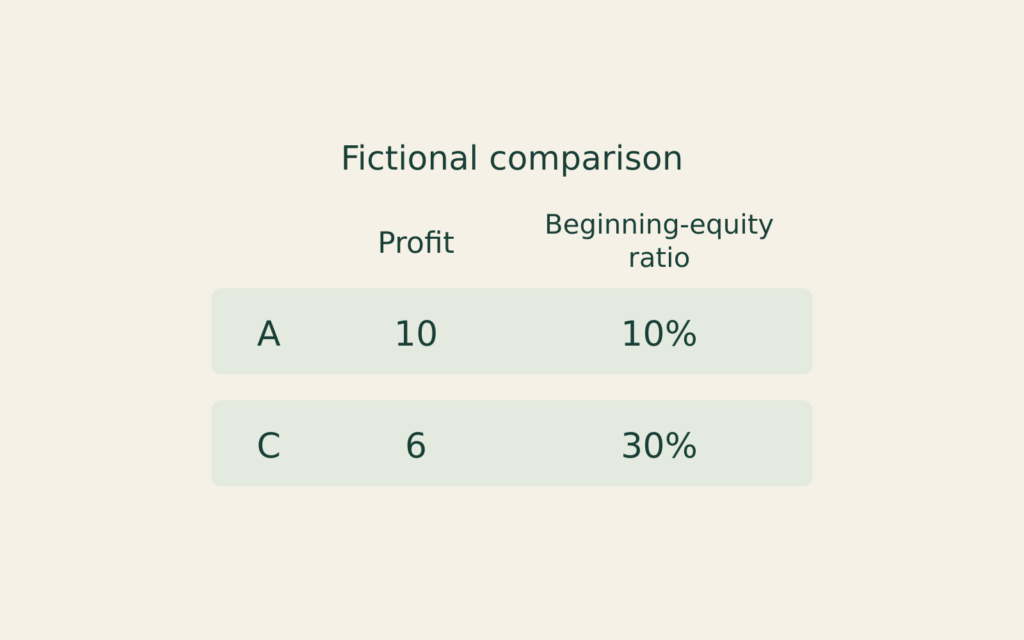
First suppose operations produce 10 units before interest. The debt-free case pays no interest and retains a profit of 10 for this calculation. Its percentage is 10/100, or 10%.
With debt of 50, interest is 2.5. Profit falls to 7.5, but dividing by equity of 50 produces 15%. With debt of 80, interest is 4 and profit is only 6. Dividing that smaller profit by equity of 20 produces 30%.
The ordering is therefore reversed: modeled profit falls from 10 to 7.5 to 6, while the displayed percentages rise from 10% to 15% to 30%. Neither the assets nor the before-interest operating result improved. In the final case, the profit numerator is 60% of the first case’s numerator, but the equity denominator is only 20% of its denominator. Their ratio is three times as large.
Find the crossover algebraically
Write assets as A, debt as D, operating result as rA and interest as iD, with A−D>0. The modeled ratio is R=(rA−iD)/(A−D). Subtracting r gives R−r=(r−i)D/(A−D). For positive debt, the sign depends on whether r exceeds, equals or falls below i.
Our first operating result was 10/100=10%, above the assumed 5% interest rate. Now reduce the operating result to 2 without changing any financing amount. The three after-interest profits become 2, −0.5 and −2. Dividing by 100, 50 and 20 gives 2%, −1% and −10%. The structure that previously displayed 30% now displays the largest negative percentage.
At an operating result of 5, all three percentages instead equal 5%: the corresponding profits are 5, 2.5 and 1. Equal percentages still do not mean equal amounts. This middle case also checks the crossover directly rather than relying only on the favorable and unfavorable examples.
Measure the change in percentage points
Holding A, D and i fixed, an operating-return change h changes R by hA/(A−D).
The three multipliers here are 1, 2 and 5. A two-percentage-point reduction in operating return therefore cuts the displayed ratios by 2, 4 and 10 percentage points. For example, changing the operating result from 10 to 8 changes the ratios from 10%, 15% and 30% to 8%, 11% and 20%. The final decline is ten percentage points, not a ten-percent proportional decline from 30%.
Reverse the calculation
Suppose instead that all three businesses report the same 15% ratio under our beginning-equity definition. Required after-interest profits are then 15, 7.5 and 3: multiply 15% by their respective equity amounts. Add back interest of 0, 2.5 and 4, and the before-interest operating results must be 15, 10 and 7.
Thus identical displayed percentages can accompany three different operating results on the same 100 units of assets. This is a separate control, not another period appended to the earlier cases. Algebraically, rearranging our equation gives r=i+(R−i)(1−D/A). Substituting R=15% and i=5% reproduces 15%, 10% and 7% as the operating returns. Knowing R alone does not select among these stipulated alternatives.
Keep the definition attached
OpenStax’s finance text defines reported ROE using average equity and separates leverage from operating efficiency. Its capital-structure discussion explains leverage’s effects. Our beginning-equity calculation is a stipulated comparison, not a financing recommendation or repayment-capacity test.
Customer Overlaps
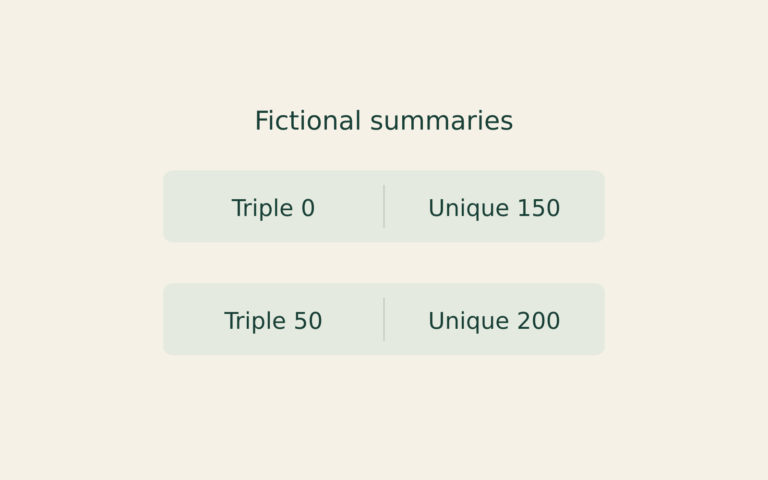
A business worksheet can contain every pairwise channel overlap yet still leave its unique-customer total unresolved.
Hedge Funding Peaks
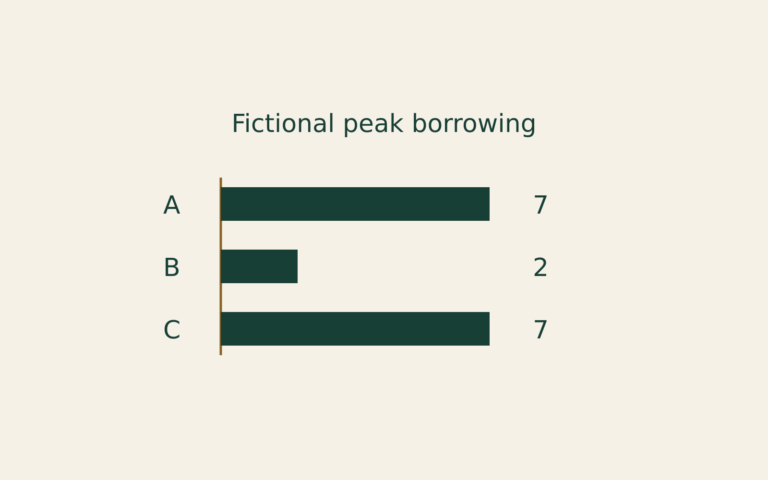
A matched terminal receipt does not specify the largest borrowing balance along the way. This fictional example connects both calculations using one price…
Inventory Margins
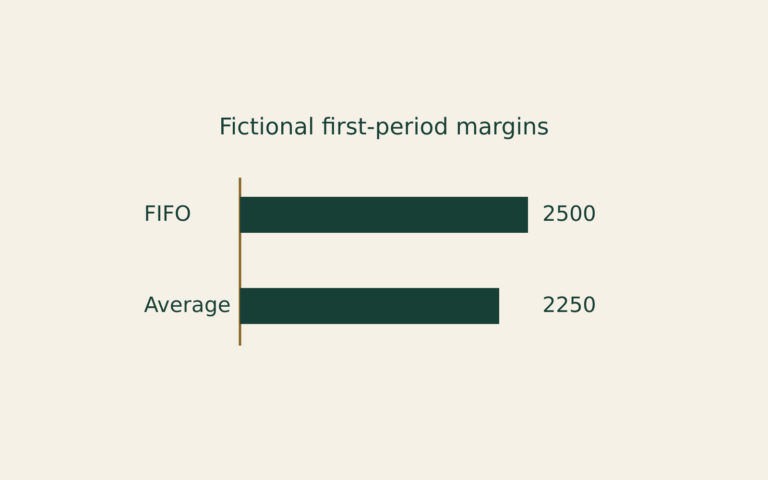
Two inventory reports can show different period margins even when purchases, sales and cash match.